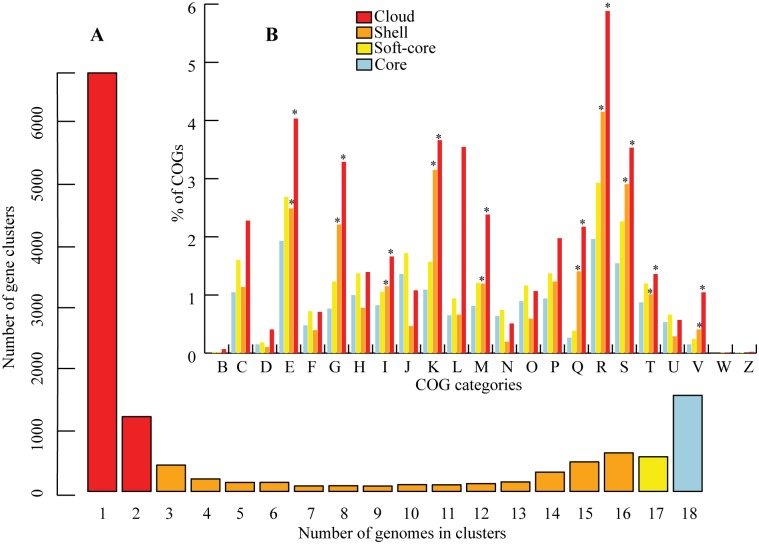
Fig 2. Structure of the pan-genome.
(A) Bar plot showing the frequencies of orthologous clusters. (B) Bar plot of percentage of COGs assigned to each cluster- (‘cloud’, ‘shell’, ‘soft-core’, and ‘core’). Individual COG categories were determined based on the number of COGs assigned to genes in each clusters. The asterisks denote the significant difference (p<0.05) of COG categories observed among the different clusters.

