
Figure 2.
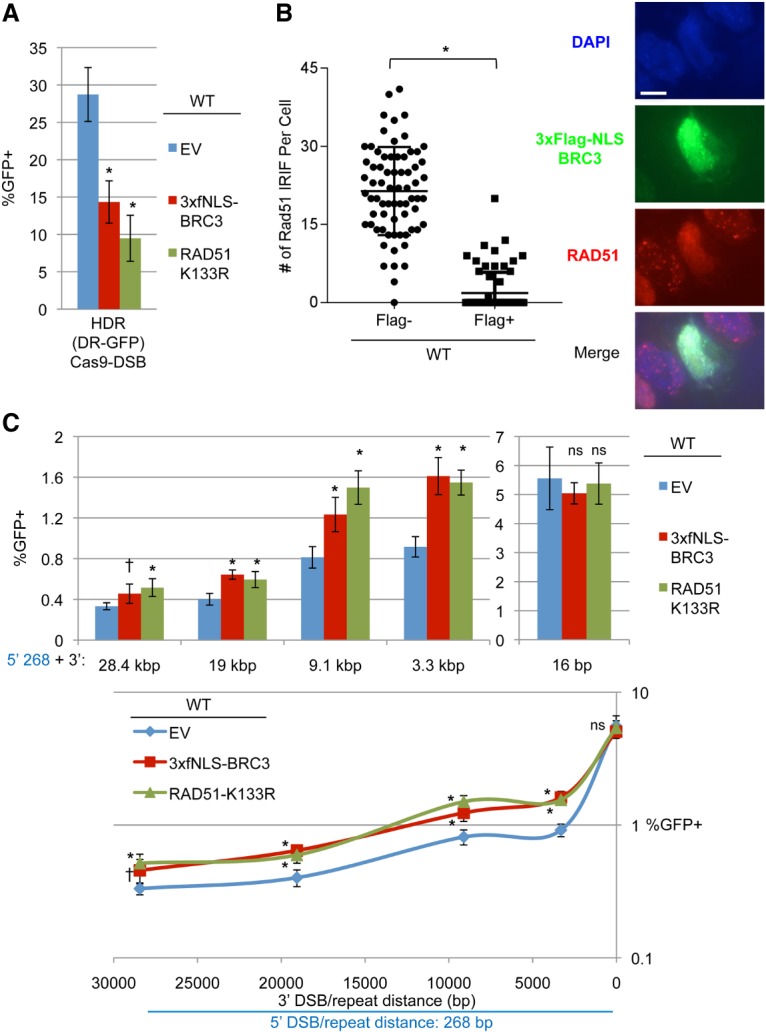
RMDs are suppressed by RAD51 when the 3′ DSB is ≥3.3 kb. (A) Two dominant-negative inhibitors of RAD51—3xFlag-NLS-BRC3 (3xfNLS-BRC3) and RAD51-K133R—disrupt HDR. Wild-type mESCs with DR-GFP were transfected with expression plasmids for an sgRNA targeting this reporter (gDR) and Cas9 along with expression plasmids for 3xfNLS-BRC3, RAD51-K133R, or a control EV. Shown are GFP+ frequencies normalized to transfection efficiency. n = 6. Error bars indicate SD. (*) P = 0.0001 compared with EV using one-way ANOVA with Dunnett's test. (B) Expression of 3xfNLS-BRC3 impairs RAD51 IRIF formation. Shown are representative images of DAPI, Flag, and RAD51 staining in wild-type mESCs transfected with 3xfNLS-BRC3 and exposed to 10 Gy IR followed by 6 h of recovery. Bar, 10 µm. Also shown is the number of RAD51 IRIFs for individual Flag− and Flag+ cells. n = 70. Lines represent the mean with SD. (*) P < 0.0001 using an unpaired two-tailed t-test. (C) The effect of 3xfNLS-BRC3 and RAD51-K133R on RMD frequency. Shown are the frequencies of GFP+ cells normalized to transfection efficiency for RMD-GFP in wild-type mESCs transfected with expression plasmids for a series of sgRNA pairs and Cas9 along with expression plasmids for 3xfNLS-BRC3, RAD51-K133R, or control EV. Also shown are the data plotted as percentage of GFP+ versus 3′ DSB/repeat distance as in Figure 1E. n = 6. Error bars indicate SD. (*) P ≤ 0.0017; (†) P = 0.0260, each compared with EV using one-way ANOVA with Dunnett's test.