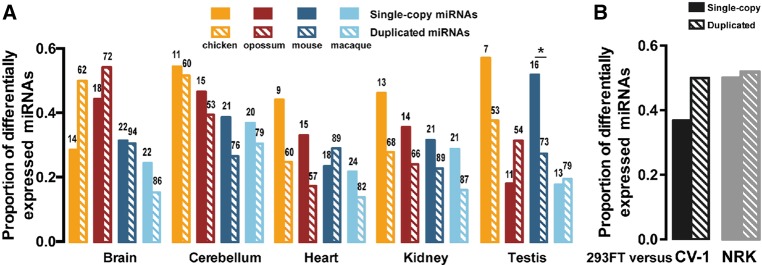
FIGURE 2.
The proportions of duplicated and single-copy miRNAs that are differentially expressed by at least fourfold change (y-axis) between humans and other vertebrate species. (A) The comparisons in five tissues between human and macaque, mouse, opossum, or chicken. (B) The comparisons between human (293FT) and green monkey (CV-1) or between human and rat (NRK) cell lines. The number above each box represents the number of single-copy or duplicated miRNAs that are broadly conserved in vertebrates and expressed in both humans and the other species.

