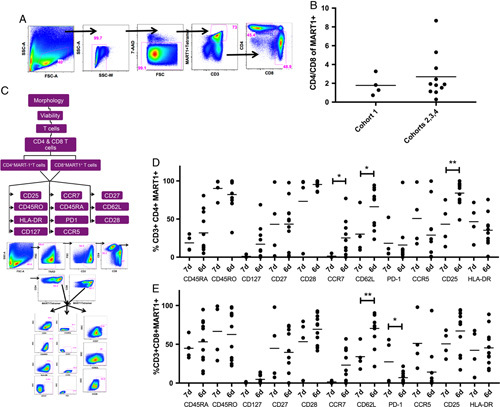
FIGURE 1.

Immune phenotypic analysis of MART-1 transgenic T cells in the final product. A, Gating strategy used to extract the percentage of transgenic CD4 and CD8 T cells. B, Ratio of CD4 versus CD8 cells. C, Gating strategy to extract the immune markers. D and E, Comparison of immune marker expression in MART1+ CD4+ (D) and CD8+ (E) T cells, comparing the 7-day culture/expansion cohort—cohort 1 (n=4), to the 6-day culture/expansion cohorts—cohorts 2, 3, and 4 (n=11). Dots represent individual data points, lines indicate means. *P<0.05; **P<0.01.
