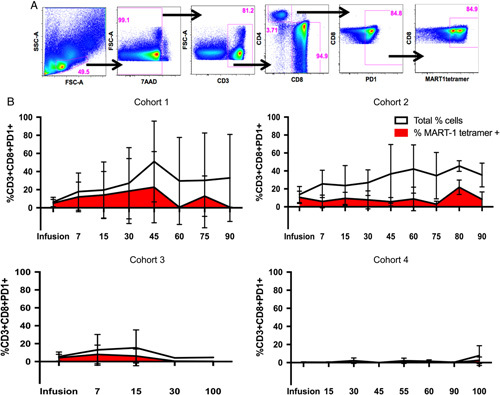
FIGURE 3.

Baseline and longitudinal proportions of total and transgenic CD8+PD1+ T cells in patients. A, Gating strategy to obtain the percentage of CD8+PD1+ T cells, and percentage of MART-1 tetramer expressing cells within that population. B, Total frequency of PD1+CD8+ expressing T cells (white), and the proportion of those cells expressing the MART-1 TCR (red) in the final infusion product and on circulating peripheral lymphocytes of the patients over time (measured in days). Error bars represent SDs. Cohort 1: n=4, cohort 2: n=4, cohort 3: n=2, cohort 4: n=2.
