Figure 3.
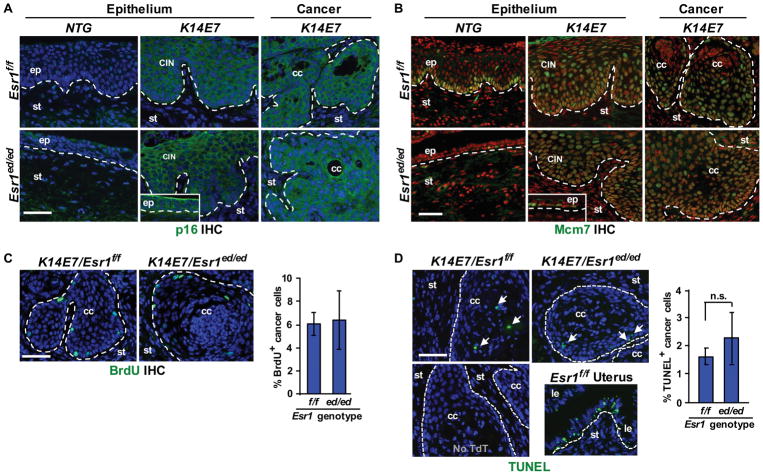
Biomarker expression, proliferation, and apoptosis are similar between ERα+ and ERα − CxCa. (A) CxCa biomarker p16 (green) in cervical neoplastic diseases arising in K14E7/Esr1ed/ed mice. Nuclei were stained with Hoechst 33258 (blue). The inset shows p16 in the nondiseased epithelia of K14E7/Esr1ed/ed mice. Dotted lines separate stroma (st) from normal epithelium (ep), dysplastic epithelium (CIN) and cancer epithelium (cc). (B) Cervical sections stained for Mcm7 (green). Nuclei were stained with Hoechst 33258 (pseoudocolored red). The inset shows Mcm7 in the nondiseased epithelia of K14E7/Esr1ed/ed compared to NTG/Esr1ed/ed. (C) Left panel: CxCa sections were stained for BrdU (green). Nuclei were stained with Hoechst 33258 (blue). Right panel: results were quantified by analyzing more than 200 cells per cancer and shown as mean ± SEM (n = 3). (D) Apoptotic indices. Left panel: CxCa sections were subjected to TUNEL assay (green). TUNEL+ cells are indicated by arrows. Nuclei were stained with Hoechst 33258 (blue). A section that was not incubated with terminal deoxynucleotidyl transferase (TdT) was used as negative control (lower left panel). Uterus from E2-treated wt mice was used as positive control (lower right panel). Le, luminal epithelium. Right panel: results were quantified and shown as mean ± SEM (n = 3). n.s., not significant. Scale bars = 50 μm.

