
Figure 1. Life expectancy at age 15, 2006–2012.
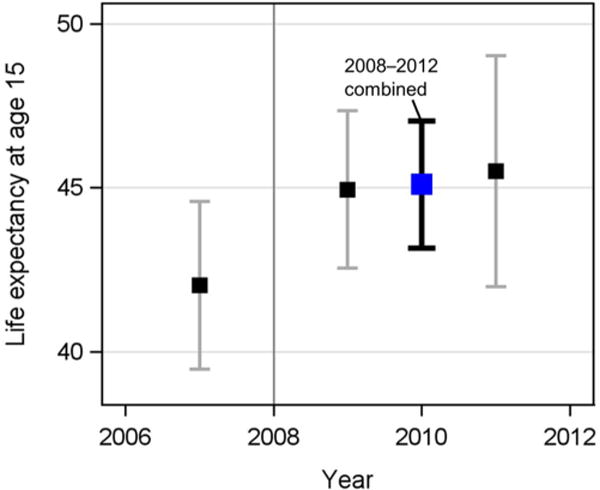
Notes: Life expectancy at age 15 is the mean length of remaining life for a 15-year-old if subjected to the prevailing pattern of age-specific mortality rates observed during a given period of time. Estimates of life expectancy for the periods 2006–2008, 2008–2010, and 2010–2012 are displayed as the squares, with 95% CIs. The timing of public-sector introduction of ART is shown using the gray vertical line.