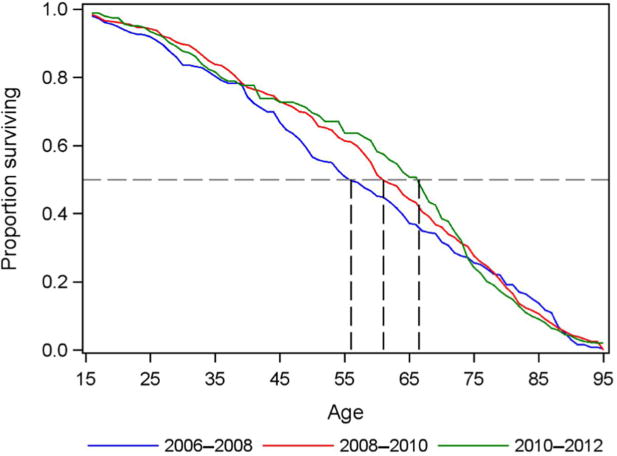
Figure 2. Survival curves pre-ART (2006–2008) and post-ART (2008–2010,2010–2012) for ages 15+.

Notes: Survival curves for pre-ART (2006–2008, blue line) and post-ART (2008–2010, red line, and 2010–2012, green line) periods. Conditional on survival to age 15, median age at death was 56 years before the introduction of ART, rising after the introduction of ART to 61 years in 2008–2010 and 67 years in 2010–2012.
