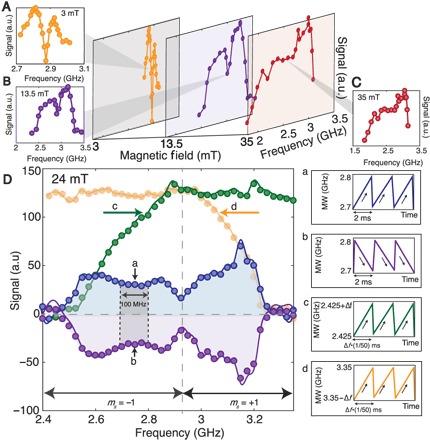
Fig. 4. Contributions of different NV orientations to DNP.

(A to C) Electronic powder pattern mapped by performing DNP in a 100-MHz window, which is swept across in frequency space. This reports on the contributions of each window to the resulting signal and different orientations’ relative contribution to DNP at different magnetic fields. Note that amplifier bandwidth limitations lead to an artificial cutoff at ≈3.2 GHz. (D) Sign contributions from different NV orientations. (a and b) Every part of the powder pattern, even if corresponding to different (ms = ±1) electronic states, produces the same sign of hyperpolarization (shaded regions) that only depends on the direction of MW sweep. Solid lines are smoothened curves. Keeping the lower frequency (c) and upper frequency (d) of the DNP window fixed provides the cumulative contribution of different parts of the electronic spectrum to the polarization buildup. It shows that half of the powder pattern is sufficient to saturate the polarization enhancement. Note that we maintain the same differential sweep rate per unit spectral width equivalent to 40 MHz/ms in all experiments.
