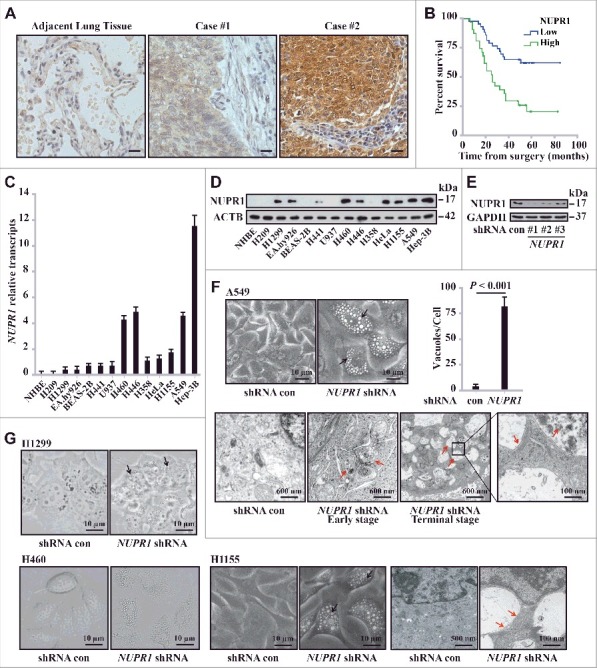
Figure 1.

NUPR1 depletion induces autolysosomal vacuolization. (A) IHC staining with anti-NUPR1 was performed on 118 NSCLC samples and their adjacent tissues. Representative images show moderate (case #1) and strong (case #2) NUPR1 staining. Scale bars: 10 µm. (B) Kaplan-Meier overall survival rates for 118 NSCLC subjects with low (0 to 5.0 staining scores, blue lines; n = 68) versus high (5.1 to 10.0 staining scores, green lines; n = 50) NUPR1 expression. Median survival was more than 80 mo for the low NUPR1 expression group versus 28 mo for the high NUPR1 expression group (P = 0.00025). (C and D) Relative NUPR1 transcript levels determined by quantitative RT-PCR shown as fold differences relative to GAPDH in a normal lung epithelial cell line (NHBE) and cancer cell lines as indicated in (C), and the NUPR1 level determined by western blotting is shown with ACTB as a loading control in (D). (E) Western blot confirming the knockdown efficiency of 3 shRNAs against human NUPR1, with fire fly luciferase as a negative control (con) and GAPDH as an internal control. (F) Representative phase-contrast micrographs of cell morphological changes following the expression of NUPR1 shRNA in A549 cells. Large and small vacuoles can be seen scattered throughout the cytoplasm in NUPR1-knockdown cells (arrows). The right graph shows the quantification of the number of vacuoles per cell from 3 different experiments (mean ± SEM). Lower panels show transmission electron micrographs (TEM) images of A549 control and A549-NUPR1 shRNA cells at the indicated magnifications. NUPR1 depletion leads to accumulation of dilated autolysosomes (arrows). The right image is a higher magnification of the indicated portion, showing electron-dense material within autolysosomes. (G) Light micrographs and electron micrographs of cell morphology following NUPR1 depletion in H1299, H460 and H1155 cells. Arrows show the vacuole membrane location.
