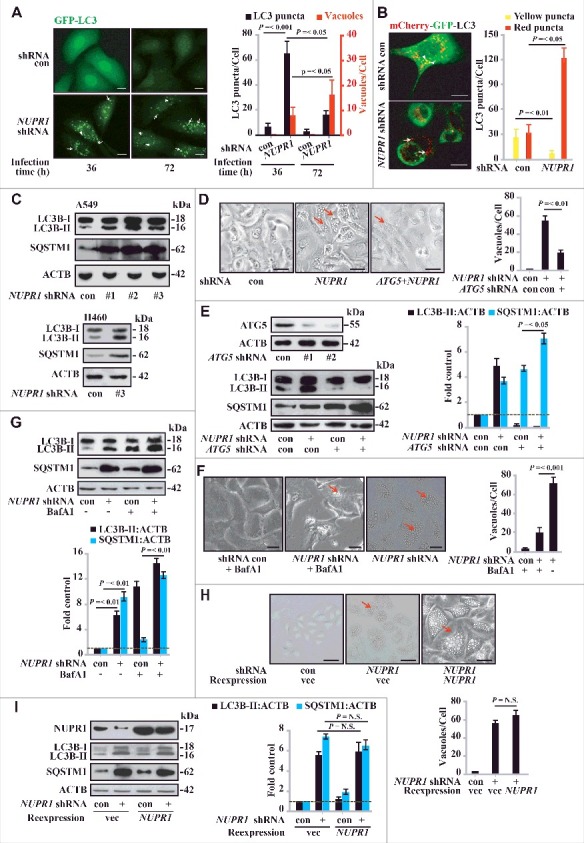
Figure 2.

NUPR1 regulates autophagic flux and autolysosomal efflux. (A) Representative fluorescence images of A549 cells transiently expressing GFP-LC3B, with NUPR1 knockdown as described in the Materials and Methods. Arrows indicate autolysosomes, whereas arrowheads indicate autophagosomes. Bar graph on the right shows the number of GFP-LC3 puncta and vacuoles per cell. Scale bars: 5 µm. (B) Representative images adapted from time-lapse movies of A549-mCherry-GFP-LC3 cells treated with the indicated shRNA. Autophagosomes (arrowheads), yellow puncta; autolysosomes (arrows), red-only puncta. Quantification of the number of LC3 puncta per cell in NUPR1-depleted and control A549 cells (10 cells per group). Scale bars: 10 µm. (C) Immunoblot analysis of LC3B and SQSTM1 levels in A549 and H460 cells expressing shRNAs against NUPR1 used in Figure 1E, with ACTB/β-actin as a loading control. (D) Cellular morphology after sequential knockdown of ATG5 and/or NUPR1 in A549 cells. The right bar graph shows the number of vacuoles per cell. Error bars represent the SD (n = 10). Scale bars: 10 µm. (E) Immunoblot analysis was performed as in (C) by knockdown of ATG5 and/or NUPR1. The left upper panel shows ATG5 knockdown efficiency. Graph depicts densitometric analysis of protein intensity as indicated, normalized to ACTB levels and expressed as fold change from untreated control (right panel). (F) Representative morphological changes in cellular vacuolization by NUPR1 depletion with or without 5 nM BafA1 treatment as indicated. The right panel is the quantification of the vacuoles per cell shown in the left panel. Scale bars: 5 µm. (G) Cells were sequentially infected with NUPR1 shRNA and treated with 10 nM BafA1. The graph shows the quantification of the LC3B-II:ACTB and SQSTM1:ACTB ratios in the lower panel from 3 different immunoblots (mean ± SEM). (H) Cellular morphology after sequential knockdown of NUPR1 and/or reintroduction of NUPR1 in A549 cells. Reintroduction of NUPR1 after NUPR1 depletion did not rescue the autolysosomal vacuolization phenotype. The right bar graph shows the number of vacuoles per cell. Error bars represent the SD (n = 10). N.S., not significant. Scale bars: 10 µm. (I) Immunoblot analysis of LC3B and SQSTM1 levels in A549 cells as indicated. The right bar graph depicts the densitometric analysis of protein intensity. N.S., not significant.
