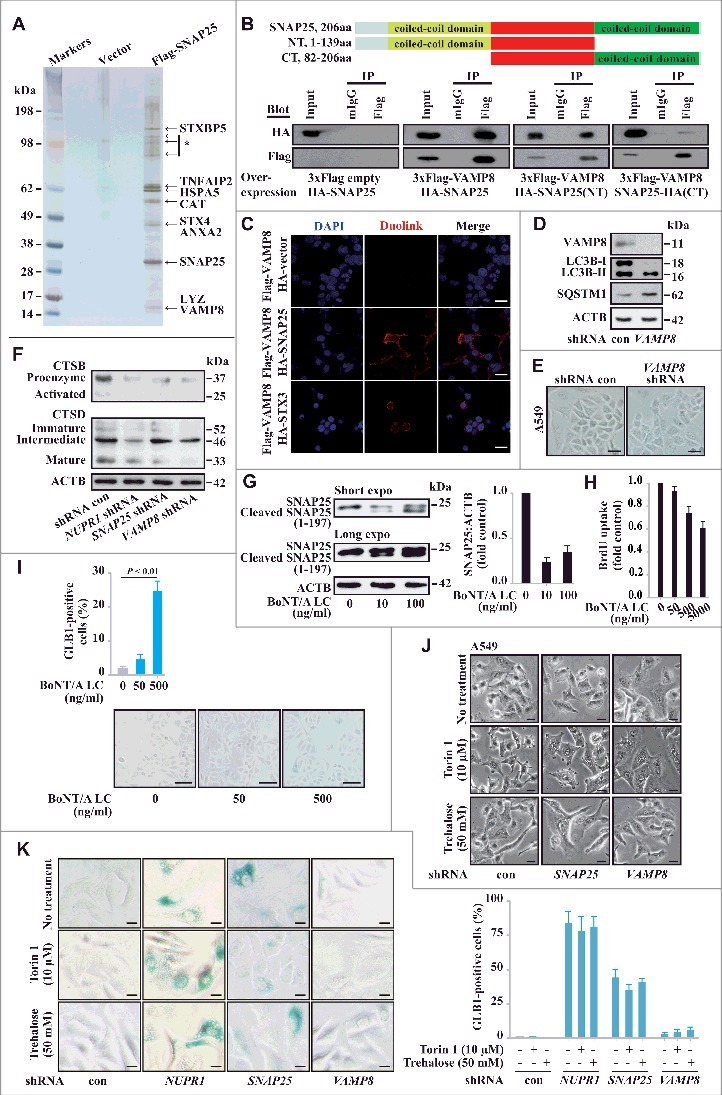
Figure 5.

SNAP25 mediates autolysosomal efflux through VAMP8. (A) Immunopurification of SNAP25-containing protein complexes. Cellular extracts from A549 cells stably expressing Flag (empty vector, control) or Flag-SNAP25 were immunopurified with an M2 anti-Flag affinity gel and eluted with 3xFLAG peptide. The eluates were resolved by SDS-PAGE, and interesting bands were analyzed by mass spectrometry. *, non-specifically bound protein bands. (B) Coimmunoprecipitation results for VAMP8 and SNAP25, as well as the N- or C-terminal truncated forms, in HEK293 cells. (C) Physical interaction between SNAP25 and VAMP8 in A549 cells. Shown is the Duolink assay with the interaction between VAMP8 and STX3 as a positive control. Nuclei are counterstained with DAPI (blue). Scale bars: 10 µm. (D) Immunoblot of LC3B and SQSTM1 in SNAP25-depleted and control A549 cells, with ACTB as a loading control. (E) GLB1 staining images in VAMP8-depleted and control A549 cells. Scale bars: 10 µm. (F) Immunoblot of CTSB and CTSD in NUPR1-, SNAP25-, and VAMP8-depleted and control A549 cells, with ACTB as a loading control. (G) SNAP25 was monitored by immunoblotting after recombinant BoNT/A LC treatment at the indicated concentrations for 16 h, with ACTB as the loading control. (H) BrdU-incorporation assay in A549 cells treated with the indicated concentrations of recombinant BoNT/A LC for 24 h. (I) Representative images of GLB1 staining in BoNT/A LC-treated and control A549 cells (left panels). Quantification of GLB1-positive cells was determined from 10 different fields, from 3 independent experiments (mean ± SEM) (right panel). Scale bars: 30 µm. (J) Representative cell images of SNAP25 or VAMP8 knockdown A549 cells following 50 mM trehalose or 10 µm torin 1 treatment for 24 h. Scale bars: 10 µm. (K) Representative images of GLB1 staining in A549-knockdown cells following the indicated treatment for 24 h (left panels). Quantification of GLB1-positive cells (right panel) was determined as in (I). Scale bars: 10 µm.
