
Figure 6.
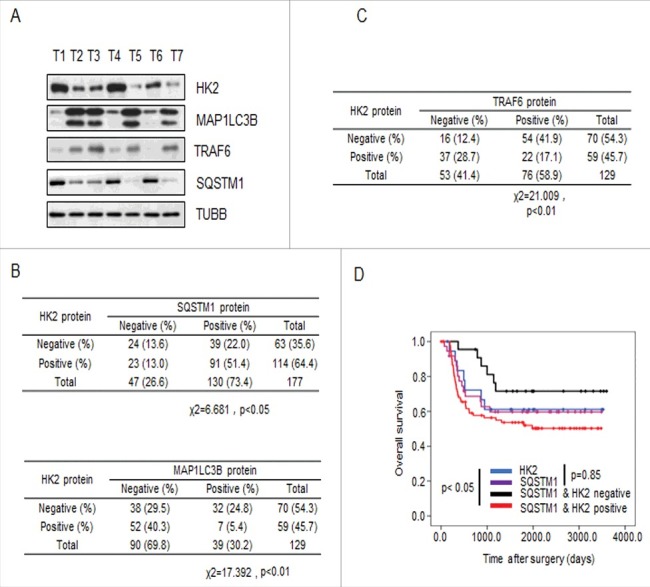
HK2 is correlated with SQSTM1 in clinical samples. (A) Immunoblot analysis of HK2, SQSTM1, MAP1LC3B and TRAF6 expression in tumors from 7 patients. (B) Correlation study of HK2, SQSTM1, and MAP1LC3B expression in the liver cancer TMA consisting of 129 samples. (C) Correlation study of HK2 and TRAF6 expression in the liver cancer TMA. (D) Kaplan-Meier plots of the overall survival of patients, stratified by expression of HK2 and SQSTM1. The data were obtained from the Sun Yat-sen University Cancer Center liver cancer dataset.