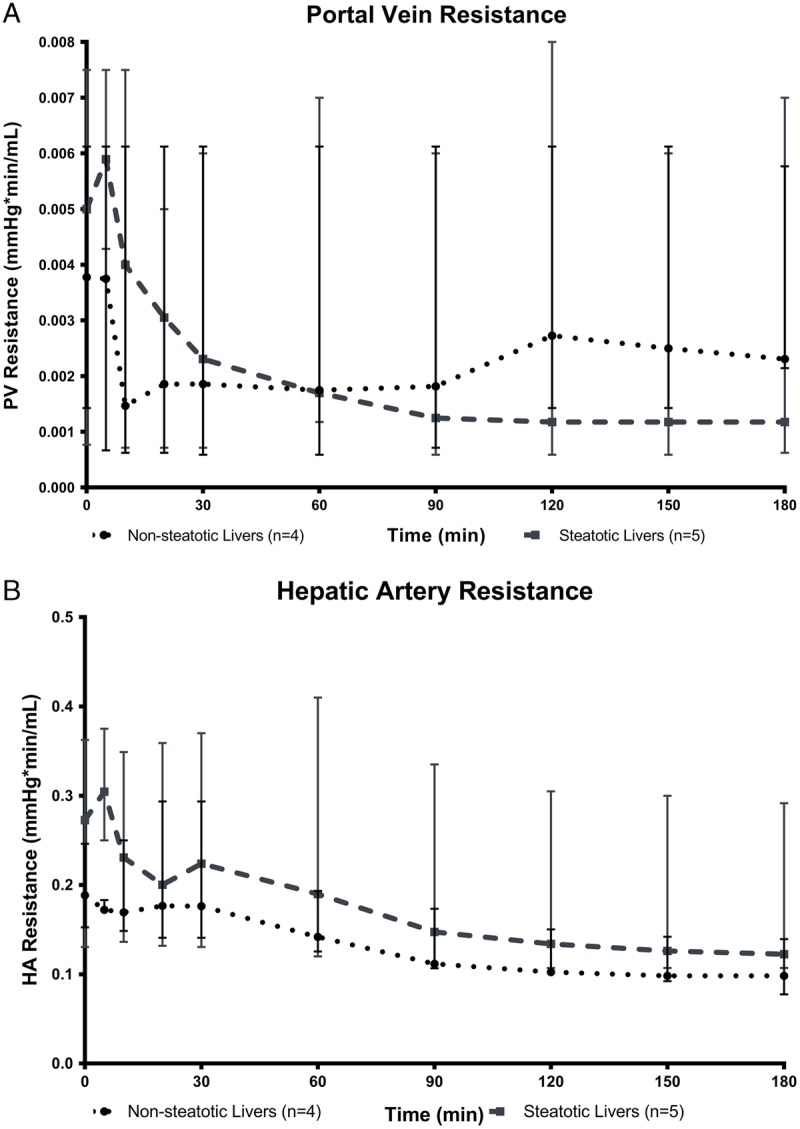
FIGURE 3.

Resistance in the PV (A) and the HA (B) calculated as quotient of pressure and flow. Hepatic artery and PV resistance decreased gradually throughout perfusion in both nonsteatotic and steatotic livers. However, no statistically significant differences were observed between the 2 groups (data are presented as median ± IQR).
