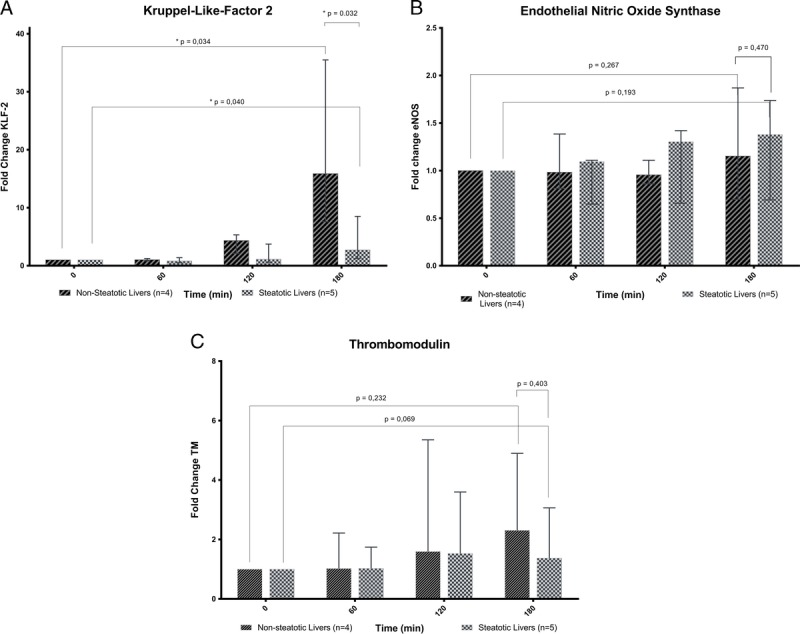
FIGURE 4.

Gene expression analyses. SNMP induces upregulation of KLF2 in both steatotic and nonsteatotic livers although significantly more in the nonsteatotic livers (A). eNOS is not significantly more expressed at the end of SNMP in both steatotic and nonsteatotic livers (B). Thrombomodulin is not significantly more expressed at the end of SNMP in both steatotic and nonsteatotic livers (C). Fold change is calculated from T=0 for each liver (data are presented as median ± IQR).
