
Figure 3.
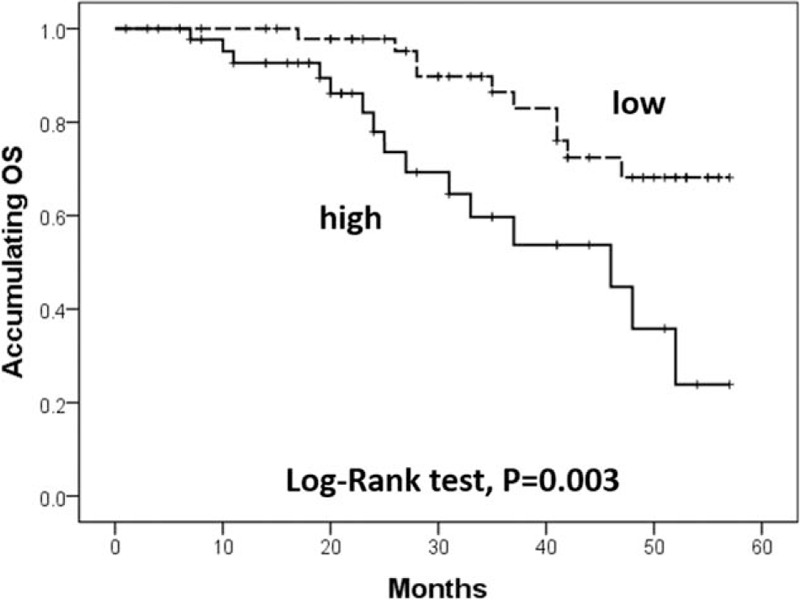
Correlation of lncRNA TUG1 expression with OS. High expression of lncRNA TUG1 was associated with worse OS compared to low expression of lncRNA TUG1. Kaplan-Meier curves and log-rank test were used to evaluate OS. lncRNAs = long non-coding RNAs, OS = overall survival, TUG1 = taurine-upregulated gene 1. P < .05 was considered significant.