
Figure 4.
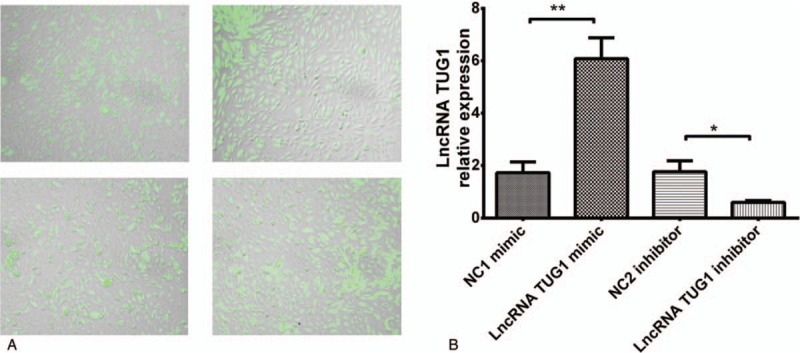
LncRNA TUG1 expression after plasmids transfection. (A) Transfection rate swere all >90% in 4 groups. (B) LncRNA TUG1 expression was increased in lncRNA TUG1 mimic group and decreased in lncRNA inhibitor group compared to NCs. ∗P < .05, ∗∗P < .01. lncRNAs = long non-coding RNAs, TUG1 = taurine-upregulated gene 1.