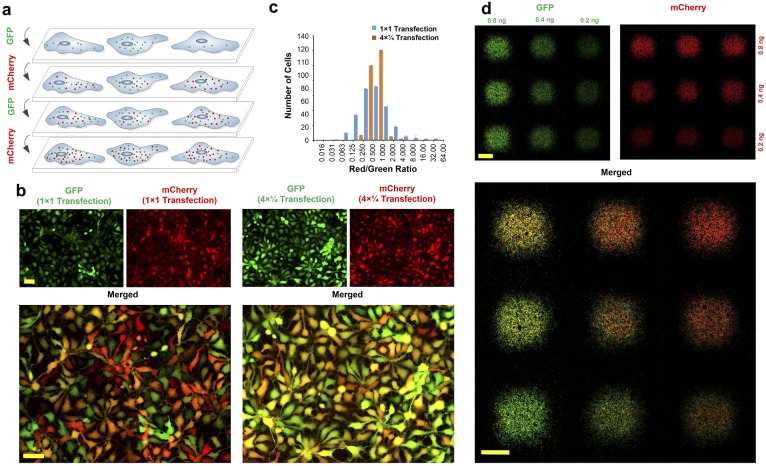
Figure 2. Interleaved transfection reduces fluctuations in delivered mRNA copy numbers and stoichiometries.
(a) Schematic illustration of multiple interleaved transfections using GFP and mCherry mRNAs. Each mRNA is delivered in multiple interleaved rounds of transfection, as opposed to being delivered all at once in a single transfection. (b) Neural progenitor cells transfected with GFP and mCherry mRNA using a standard single transfection protocol (‘1 × 1’; i.e. the full dose of each mRNA is applied in a single transfection) versus an interleaved transfection protocol (‘4 × ¼"; i.e. one quarter doses of each mRNA are applied using four interleaved transfections). All images were acquired using automated software to prevent saturation. (c) Ratio of red (mCherry) to green (GFP) fluorescence intensity per cell for both single and interleaved transfection protocols. Image correlation analysis was performed on the images shown in (b) using WCIF plugin for ImageJ. Efficiency of interleaved transfection is calculated using Pearson’s Correlation Coefficient (PCC) and Mander’s Overlap Coefficient (MOC). PCC = 0.85 and MOC = 0.92 for interleaved transfections compared to PCC = 0.54 and MOC = 0.79 for single transfections (−1 < PCC < 1; 0 < MOC < 1). Both PCC and MOC represent average values from three independent experiments. (d) Precise RNA dosage control using the magnetically reconfigurable spotting platform. GFP mRNA was spotted in a 3 × 3 matrix at three different dosages: right column (1x), middle column (2x) and left column (4x). mCherry mRNA was delivered to the same spots at three different dosages as follows: bottom row (1x), middle row (2x) and top row (4x). To generate this pattern, we delivered GFP and mCherry mRNAs using our interleaved transfection protocol to achieve highest co-transfection efficiency (this pattern is also reproducible using standard transfection protocols, although with reduced efficiency). In the process, 1x concentration of GFP (1.8 ng; 0.2 ng per spot) was delivered to the plate while all nine magnets were active. In the next step, another 1x concentration of GFP (1.2 ng; 0.2 ng per spot) was delivered to the cells while the 3 magnets of the rightmost column were inactive. Finally, 2x concentration of GFP (1.2 ng; 0.4 ng per spot) was delivered to the cells while the middle and the rightmost columns of 6 magnets were inactive. A similar process was repeated for the mCherry along the perpendicular direction (i.e. by activating/inactivating magnets along the horizontal rows rather than the vertical columns). Scale bars: 100 µm in (b), 1 mm in (d).

