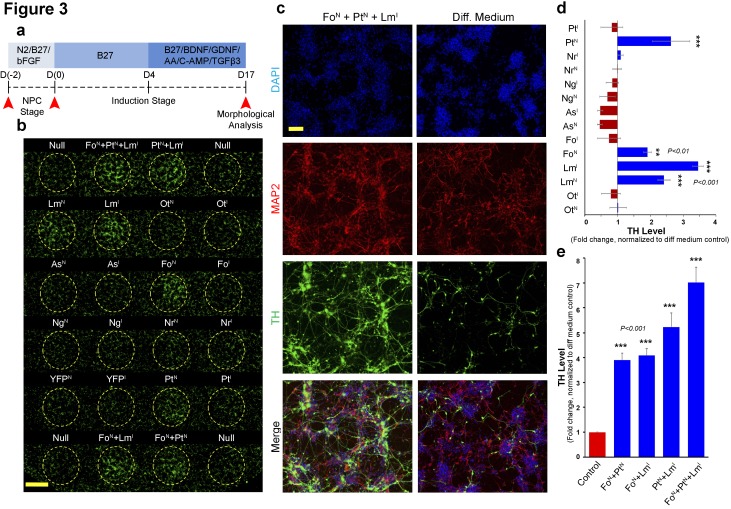
Figure 3. Magnetically reconfigurable spotting platform can screen and identify key transcription factors promoting dopaminergic cell fate.
(a) Timeline of the mRNA-induced differentiation process (proliferative NPC stage from day −2 to 0; early induction stage after day 0). Red arrows indicate time points of transfection before mitogen growth factor removal, transfection after growth factor removal (induction stage), and the final analysis at 17 days after growth factor removal. (b) Immunocytochemistry at day 17 for TH (green) showing upregulation of TH when FOXA2 is delivered to NPCs (FoN), when PITX3 is delivered to NPCs (PtN), and when LMX1A is delivered either to NPCs (LmN) or during induction (LmI). Combinations of these three conditions also increase the number TH+ neurons. (c) Double staining (MAP2+/TH+) results from cells transfected with the most effective combination (FoN +PtN + LmI) compared to non-transfected cells (Diff. Medium). (d and e) Quantitative TH gene expression analysis at day 17 comparing all single factors delivered at NPC (N) and early induction (I) stages (d), and temporal transfection of the selected combinations of double and triple factors (e). All quantifications were done with n = 3 independent experiments (mean ±s.e.m), ***(p<0.001), **(p<0.01), *(p<0.05) (compared to control, Dunnett's test). Abbreviations: TH, tyrosine hydroxylase; Ot, OTX2; Lm, LMX1A, Fo, FOXA2; As, ASCL1; Ng, NGN2; Nr, NURR1; Pt, PITX3; Superscript ‘N’, proliferative NPC stage; Superscript ‘I’, induction stage after mitogen withdrawal. Scale bars: 1 mm in (b), 100 µm in (c).

