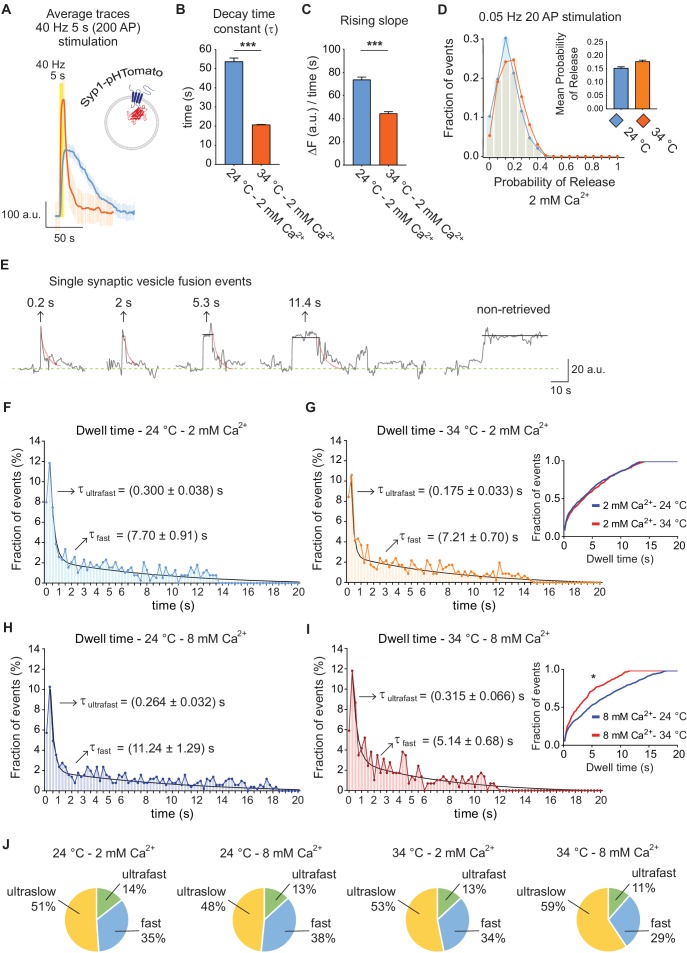
Figure 5. Trafficking of Syp1-pHTomato at different temperatures reproduces vGluT1-pHluorin behavior.
(A) Average non-normalized 40 Hz (200 AP) traces of Syp1-pHTomato at 24°C and 2 mM extracellular Ca2+ (blue), or at 34°C and 2 mM Ca2+ (orange). (B) Average decay time constants (τ) of the fluorescence return to baseline after 40 Hz stimulation, calculated with a single exponential decay fit. (C) Slope of the rise in fluorescence triggered by 40 Hz stimulation, expressed as change in fluorescence over time and calculated by linear regression. For B to D. Statistical analysis was performed applying Kruskal-Wallis analysis (non-parametric ANOVA) with Dunn’s multiple comparisons post-test. *p<0.05; **p<0.01; ***p<0.001; ***p<0.0001. (D) Distribution of probabilities of release at 24°C (blue) or 34°C (orange) and 2 mM extracellular Ca2+ concentration. Inset: mean release probability for each group. 2 mM Ca2+ at 24°C: 0.15 ± 0.01. 2 mM Ca2+ at 34°C: 0.17 ± 0.01. (E) Example traces of de-noised single synaptic vesicle fusion events measured with Syp1-pHTomato, showing different dwell time lengths. (F) Distribution of dwell time durations at 24°C and 2 mM extracellular Ca2+. Black line: double exponential decay fit (R-square = 0.922; RRS = 0.001336). Arrows: decay constants for the ultrafast and fast component of the exponential. (G) Distribution of dwell time durations at 34°C and 2 mM extracellular Ca2+. Black line: double exponential decay fit (R-square = 0.593; RRS = 0.001423). Arrows: decay constants for the ultrafast and fast component of the exponential. Inset: cumulative histogram comparing the effect of temperature on dwell times at 2 mM Ca2+, there are no significant differences. (H) Distribution of dwell time durations at 24°C and 8 mM extracellular Ca2+. Black line: double exponential decay fit (R-square = 0.911; RRS = 0.00122). Arrows: decay constants for the ultrafast and fast component of the exponential. (I) Distribution of dwell time durations at 34°C and 8 mM extracellular Ca2+. Black line: double exponential decay fit (R-square = 0.865; RRS = 0.002644). Arrows: decay constants for the ultrafast and fast component of the exponential. Inset: cumulative histogram comparing the effect of temperature on dwell times at 8 mM Ca2+, *=p < 0.05. (J) Pie charts showing the percentage of each mode of retrieval for all experimental groups. Green: ultrafast retrieval (dwell time duration between 0 and 1 s). Blue: fast endocytosis (dwell time of 1 s to 20 s). Yellow: ultra-slow retrieval (>20 s). Note that the ratio of each type of endocytosis does not change with Ca2+ or temperature. For H to K. Kolmogorov-Smirnov test: 24°C 2 mM Ca2+ vs. 24°C 8 mM Ca2+: p=0.0011; 34°C 2 mM Ca2+ vs. 34°C 8 mM Ca2+: p=0.0015; 24°C 2 mM Ca2+ vs 34°C 2 mM Ca2+: non-significant; 24°C 8 mM Ca2+ vs 34°C 8 mM Ca2+: p<0.0001. Kruskal-Wallis test: p<0.0001; Dunn’s post-test: 24°C 2 mM Ca2+ vs. 24°C 8 mM Ca2+: p<0.001; 34°C 2 mM Ca2+ vs. 34°C 8 mM Ca2+: non-significant; 24°C 2 mM Ca2+ vs 34°C 2 mM Ca2+: non-significant; 24°C 8 mM Ca2+ vs 34°C 8 mM Ca2+: p<0.0001. For all the data presented in this figure. 24°C – 2 mM Ca2+: 423 boutons from seven coverslips; 24°C – 8 mM Ca2+: 384 boutons from seven coverslips; 34°C – 2 mM Ca2+: 393 boutons from six coverslips; 34°C – 8 mM Ca2+: 361 boutons from seven coverslips. At least three independent experiments (cultures).

