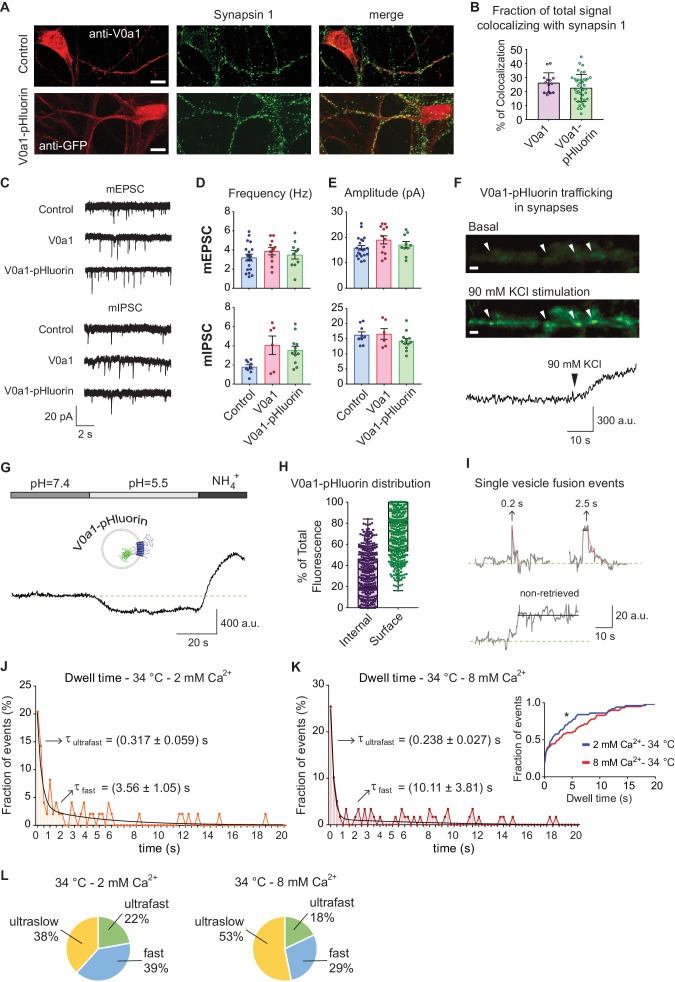
Figure 6. V0a1-pHluorin characterization and presynaptic trafficking.
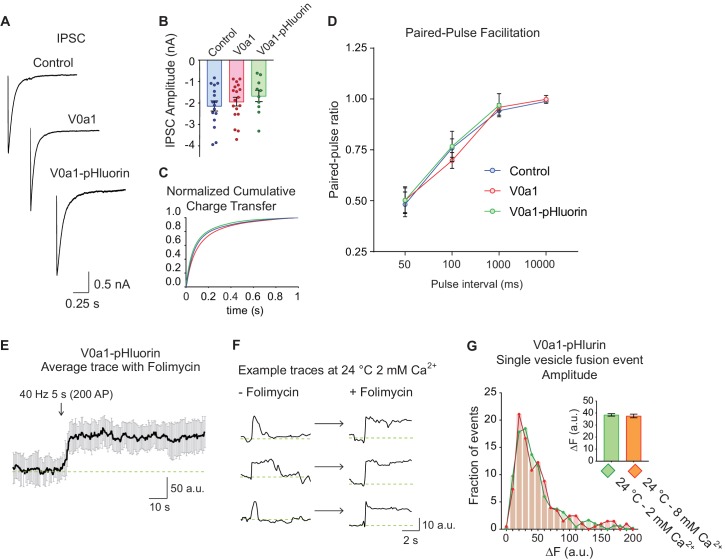
(A) Immunofluorescence of control (empty vector) and V0a1-pHluorin expressing hippocampal neurons. Top: control neuron stained with anti-V0a1 antibody to reveal endogenous V0a1 levels and distribution in RED. Bottom: V0a1-pHluorin expressing neuron immunostained with anti-GFP to show levels and distribution of the fusion protein in RED. For both, in GREEN staining against synapsin one is shown. White scale bar = 10 μm. (B) Quantification of colocalizing signal between Synapsin one and V0a1 or V0a1-pluorin. Colocalization analysis was object based, using a custom macro for Fiji. Positive colocalization was defined as an overlap in the area with above threshold signal in both channels after image segmentation. The % of colocalizing area was calculated. (C) Example traces of miniature inhibitory (mIPSC) and excitatory (mEPSC) postsynaptic currents for control (mock virus transfected), V0a1 over-expression and V0a1-pHluorin groups. Current clamp experiments were performed at room temperature and recorded for 5 min. (D) Frequency (Hz) of mIPSC (top) and mEPSC (bottom) for control, V0a1 and V0a1-pHluorin groups. (E) Amplitude (pA) of mIPSC (top) and mEPSC (bottom) for control, V0a1 and V0a1-pHluorin groups. For D to F: mIPSC: control = 9 cells; V0a1 = 7 cells; V0a1-pHluorin = 13 cells; mEPSC: control = control = 18 cells; V0a1 = 12 cells; V0a1-pHluorin = 10 cells. 1–3 neurons were patched per coverslip, 4–5 independent experiments (cultures). Also see the analysis of evoked neurotransmission in V0a1 and V0a1-pHluorin groups in Figure 6—figure supplement 1. (F) Representative wide-field fluorescence image from V0a1-pHluorin expressing neurons, before (basal signal) and after stimulation with 90 mM KCl, showing exocytosis of the probe. White arrowheads: presynaptic boutons. The quantification of fluorescence intensity over time for one of the boutons is shown in below images. White scale bars = 2 μm. (G) Example trace (average from one experiment) of V0a1-pHluorin fluorescence changes after Tyrode’s buffer pH = 5.5 perfusion and NH4+ 50 mM application. (H) Quantification of the distribution (ratio) of V0a1-pHluorin in internal membranes (internal – purple) and plasma membrane (surface – green). 420 boutons analyzed from five coverslips (three independent experiments – cultures). (I) Example traces of de-noised single synaptic vesicle fusion events measured with V0a1-pHluorin, showing different dwell time lengths. Example traces after strong stimulation (40 Hz, 5 s) and folimycin treatment are shown in Figure 6—figure supplement 1. (J) Distribution of dwell time durations at 34°C and 2 mM extracellular Ca2+. Black line: double exponential decay fit (R-square = 0.837; RRS = 0.01181). Arrows: decay constants for the fast and slow component of the exponential. 95 boutons from six coverslips. (K) Distribution of dwell time durations at 34°C and 8 mM extracellular Ca2+. Black line: double exponential decay fit (R-square = 0.885; RRS = 0.009151). Arrows: decay constants for the fast and slow component of the exponential. (L) Pie charts depicting the ratio of each mode of retrieval respect to the total number of measured events, at 34°C and 2 or 8 mM extracellular Ca2+. Green: ultrafast retrieval (dwell time duration between 0 and 1 s). Blue: fast endocytosis (dwell time of 1 to 20 s). Yellow: ultra-slow retrieval (>20 s). For J to L. 140 boutons from six coverslips. Inset: cumulative histogram comparing the effect of different Ca2+ concentration at 34°C. Kolmogorov-Smirnov test of cumulative histogram: 34°C 2 mM Ca2+ vs. 34°C 8 mM Ca2+: p=0.0086.


