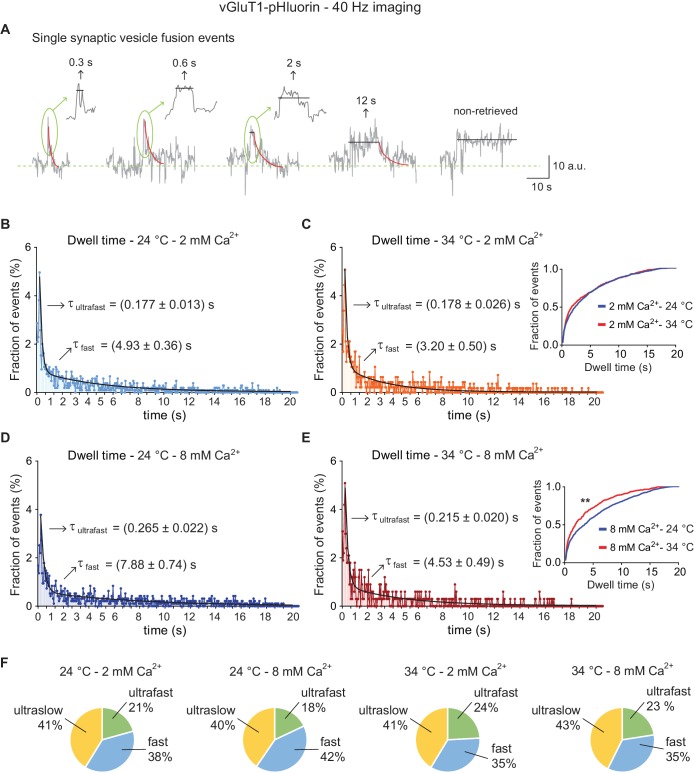
Figure 7. High-speed imaging of vGluT1-pHluorin corroborates the presence of ultrafast retrieval for single synaptic vesicle fusion events.
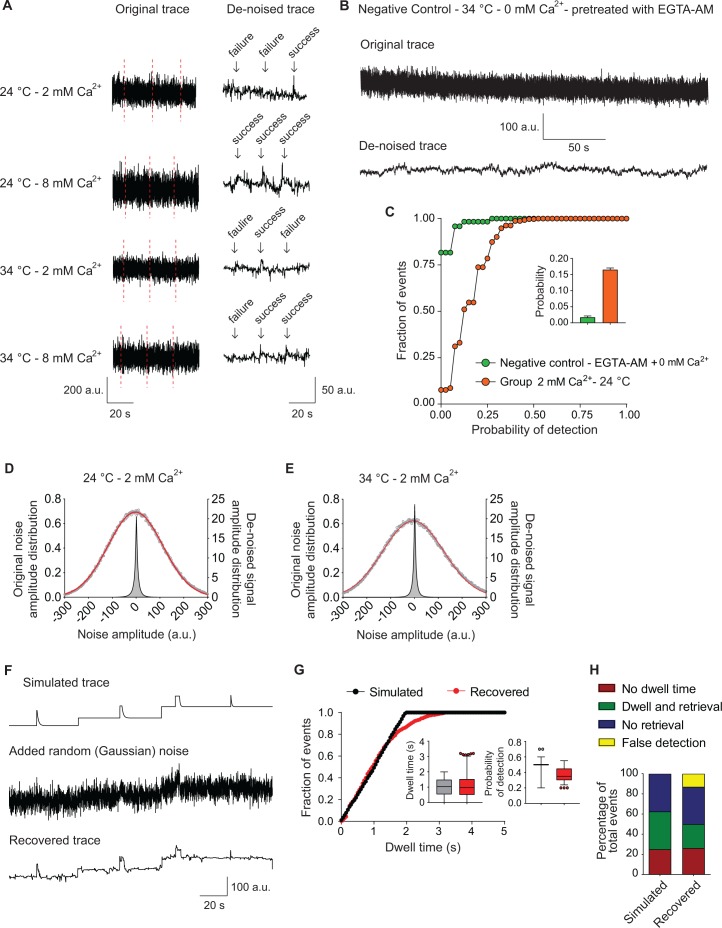
(A) Example traces for single vesicle fusion events after de-noising, measured with vGluT1-pHluorin imaging at a speed of 40 Hz. Arrows and insets: expansion of the peak showing dwell time lengths in detail. (B) Distribution of dwell time durations at 24°C and 2 mM extracellular Ca2+. Black line: double exponential decay fit (R-square = 0.8377; RRS = 0.00115). Arrows: decay constants for the ultrafast and fast component of the exponential. (C) Distribution of dwell time durations at 34°C and 2 mM extracellular Ca2+. Black line: double exponential decay fit (R-square = 0.7768; RRS = 0.00121). Arrows: decay constants for the ultrafast and fast component of the exponential. Inset: cumulative histogram comparing the effect of temperature on dwell times at 2 mM Ca2+, there is no significant effect. (D) Distribution of dwell time durations at 24°C and 8 mM extracellular Ca2+. Black line: double exponential decay fit (R-square = 0.8667; RRS = 0.00119). Arrows: decay constants for the ultrafast and fast component of the exponential. (E) Distribution of dwell time durations at 34°C and 8 mM extracellular Ca2+. Black line: double exponential decay fit (R-square = 0.770; RRS = 0.0023). Arrows: decay constants for the ultrafast and fast component of the exponential. Inset: cumulative histogram comparing the effect of temperature on dwell times at 8 mM Ca2+, **=p < 0.01. (F) Pie charts depicting the relative contribution of the three modes of retrieval to total endocytosis for all experimental groups. Green: ultrafast retrieval (dwell time duration between 0 and 1 s). Blue: fast endocytosis (dwell time of 1 to 20 s). Yellow: ultra-slow retrieval (>20 s). Note that the percentage of each type of endocytosis is not greatly affected by changes in Ca2+ or temperature. For B to E. Kolmogorov-Smirnov test: 24°C 2 mM Ca2+ vs. 24°C 8 mM Ca2+: p<0.0001; 34°C 2 mM Ca2+ vs. 34°C 8 mM Ca2+: p=0.0043; 24°C 2 mM Ca2+ vs 34°C 2 mM Ca2+: p=0.08271; 24°C 8 mM Ca2+ vs 34°C 8 mM Ca2+: p<0.0001. Kruskal-Wallis test: p<0.0001; Dunn’s post-test: 24°C 2 mM Ca2+ vs. 24°C 8 mM Ca2+: p<0.0001; 34°C 2 mM Ca2+ vs. 34°C 8 mM Ca2+: non-significant; 24°C 2 mM Ca2+ vs 34°C 2 mM Ca2+: non-significant; 24°C 8 mM Ca2+ vs 34°C 8 mM Ca2+: p<0.0001. For all the data presented in this figure: 24°C – 2 mM Ca2+: 558 boutons from eight coverslips; 24°C – 8 mM Ca2+: 474 boutons from seven coverslips; 34°C – 2 mM Ca2+: 327 boutons from seven coverslips; 34°C – 8 mM Ca2+: 209 boutons from five coverslips. At least three independent experiments (cultures). Also see Figure 7—figure supplement 1 for analysis of negative controls and simulated traces. Legends to the figure supplements.


