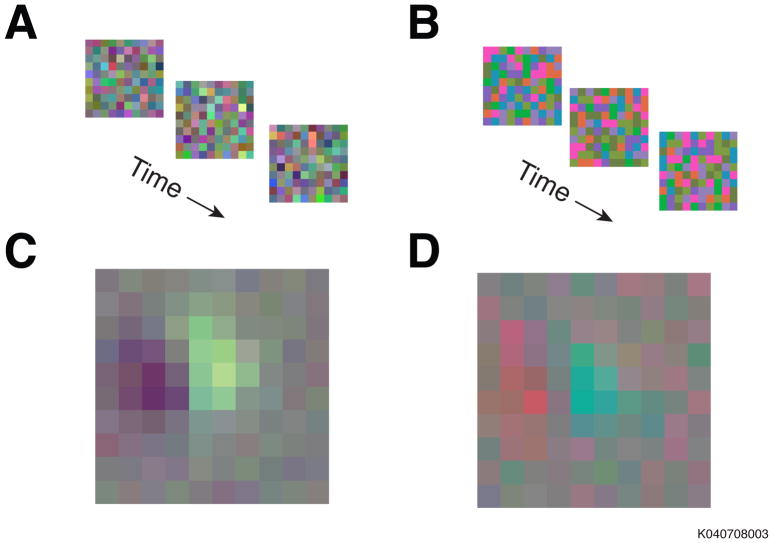
Figure 1.
The responses of individual V1 neurons from an awake fixating monkey were probed with stimuli from two different distributions. (a) Stimuli from the phosphor noise distribution. The color of each square was determined by the independent modulation of the three phosphors in a CRT monitor. (b) Stimuli from the cone noise distribution. Each colored square modulated the activity of the three photoreceptor-types independently. (c) The average stimulus that preceded a spike during the presentation of the cone noise. (d) The average stimulus that preceded a spike from the same neuron during the presentation of the phosphor noise.

