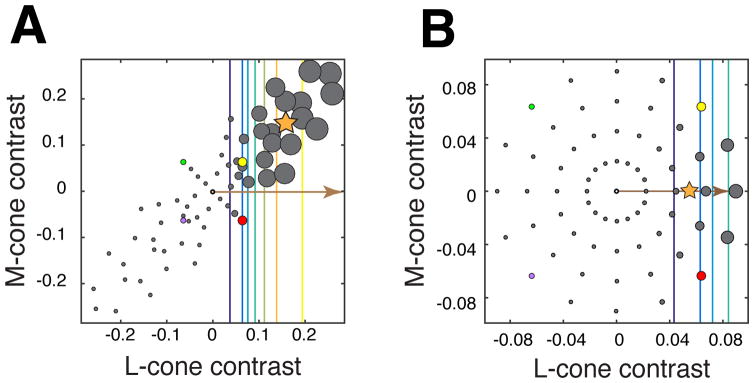
Figure 2.
Responses of a hypothetical neuron that receives only L-cone input. For simplicity, only L- and M-cone modulations are simulated in this example. The position of each gray point represents a stimulus in the LM plane. The size of each point represents the magnitude of the corresponding response. Contour lines, from cool to warm colors, represent the increasing responses of the neuron to stimuli of progressively higher contrast. The brown arrow indicates the preferred color direction of the neuron, and the orange star represents the response-weighted average stimulus (RWA). (a) A distended stimulus distribution in which L- and M-cone modulations are positively correlated. The RWA does not align with the neuron’s preferred direction. (b) A radially symmetric stimulus distribution of L- and M-cone modulations. The RWA aligns with the preferred direction. For reference, the purple, green, yellow, and red points represent identical lights in each distribution.

