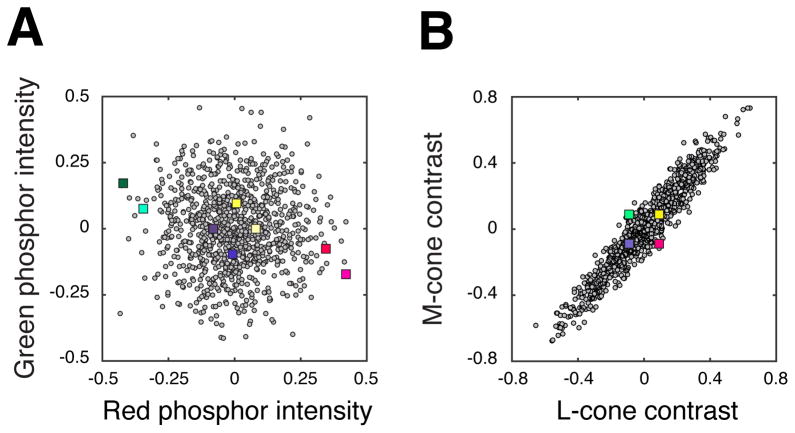
Figure 3.
Phosphor noise stimuli (gray circles) and cone noise stimuli (colored squares) represented in two color spaces. (a) Phosphor and cone noise stimulus distributions projected onto the red-green plane of phosphor space. The phosphor noise distribution is approximately radially symmetric (RS) in this space, and the cone noise distribution is distended. (b) The same two distributions projected onto the LM plane of cone space. In this color space, the cone noise distribution is approximately RS, and the phosphor noise distribution is distended. Only four colored squares are visible because +S- and −S-cone stimuli have an equal projection onto this plane.

