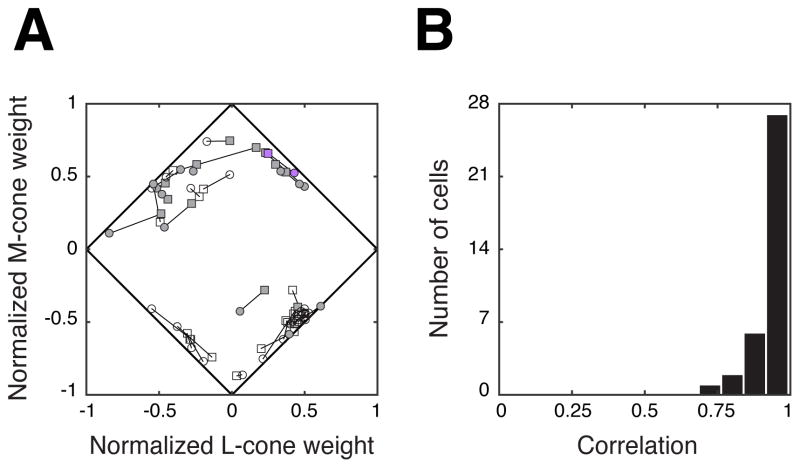
Figure 4.
(a) Normalized cone weight estimates from the population of neurons recorded in this experiment (n = 35). Two cone weight estimates (connected with black lines) were obtained from each neuron: one from the responses to the phosphor noise (circles), and one from the responses to the cone noise (squares). Shaded symbols indicate positive S-cone weights, and unshaded symbols indicate negative S-cone weights. The example neuron from Figure 1 is highlighted in purple. (b) Correlation coefficients between the normalized cone weight estimates obtained from the two distributions. Cone weight estimates derived from the phosphor noise agreed closely with those derived from the cone noise for the majority of tested neurons.

