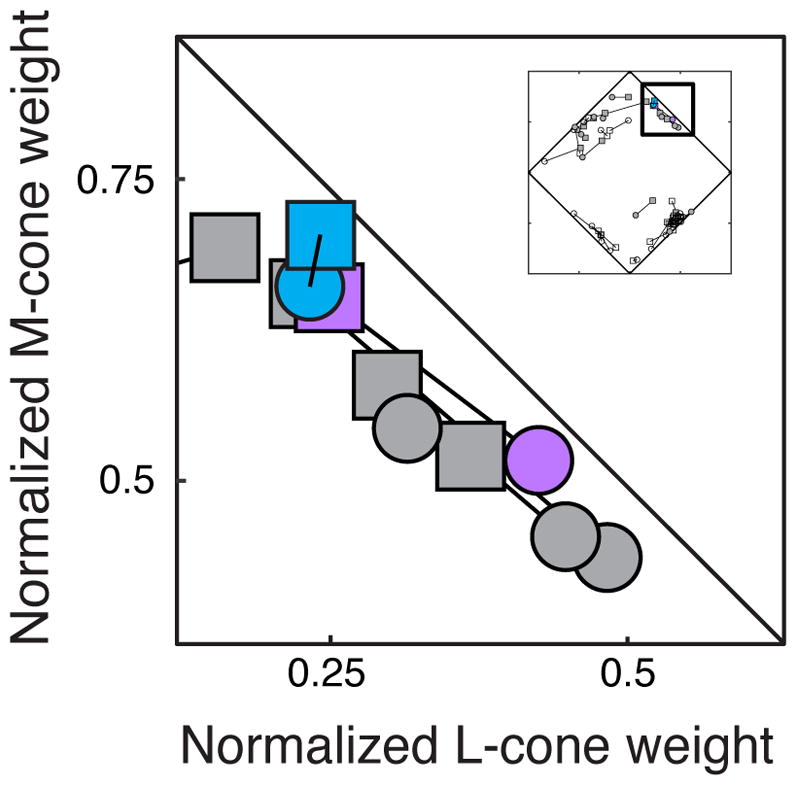
Figure 5.

Normalized cone weight estimates for the example neuron from Figure 1 estimated via the response-weighted average (purple) and maximum likelihood (blue). Normalized cone weight estimates derived from the phosphor noise (squares) agreed closely with those derived from the cone noise (circles) using both techniques.
