Figure 1.
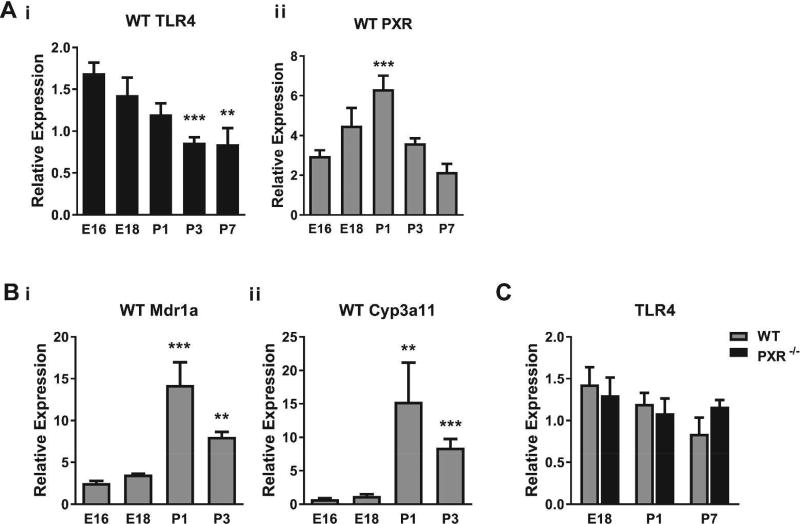
Ontogeny of intestinal PXR and TLR4 expression. (A) qRT-PCR showing mRNA expression levels of TLR4 (i) and PXR (ii) relative to β-actin in the intestines of C57BL/6 (WT) mice at the indicated prenatal (E) or postnatal (P) times. Shown are the means and SEMs from three separate experiments with 6–11 mice per group. ** P ≤ 0.01, *** P ≤ 0.001 for TLR4 or PXR levels vs. E16 mice. (B) Expression levels of PXR target genes in intestinal tissues of WT mice. ** P ≤ 0.01, *** P ≤ 0.001 for levels of Mdr1a (i) or Cyp3a11 (ii) vs. E16 mice. Results are from two separate experiments with 7–8 mice per group. Comparisons in A and B were by Kruskal-Wallis one-way analysis of variance (ANOVA) with Dunn’s post-test. (C) Expression levels of TLR4 mRNA in intestinal tissues of WT and PXR−/− mice. There were no differences in levels of TLR4 transcripts between the groups at the indicated times by unpaired t test. Results are representative of four separate experiments with 4–8 mice per group.

