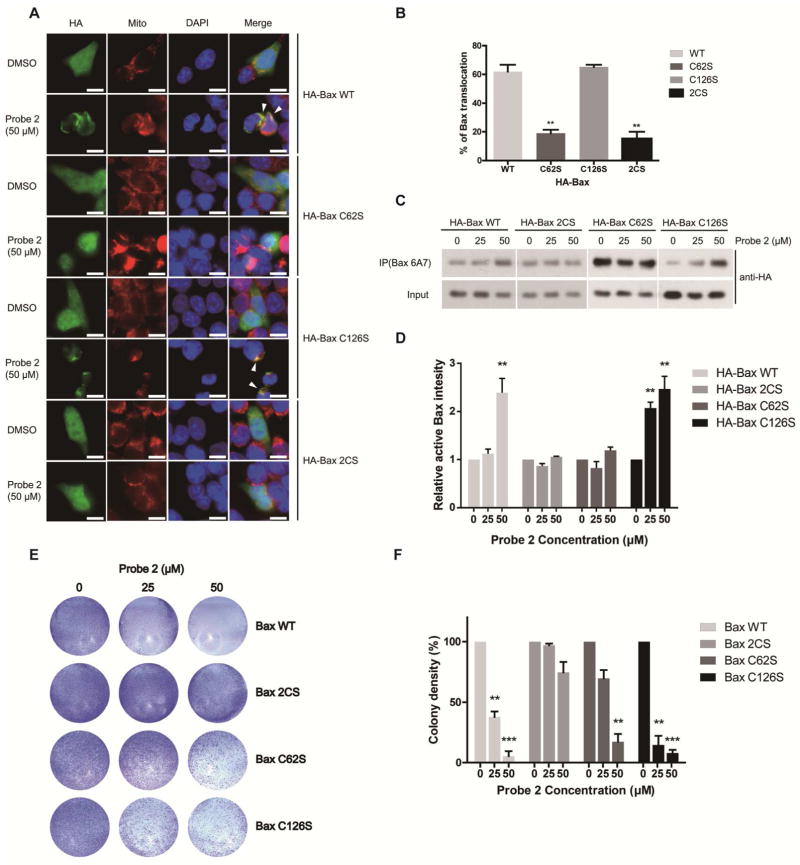
Figure 3. Covalent modification of Cys62 is critical for 2-HD-induced Bax activation, translocation and cell death.
(A) A confocal microscopy analysis of Bax translocation to mitochondria. Mitochondria and Nuclei were fluorescently stained with MitoTracker and DAPI. Scale bar, 10 μm. (B) Quantitative analysis of the images. Data are represented as mean +/− SD, n=3, **, P<0.01. (C) Detection of the activated Bax (anti-Bax 6A7) by western blot. (D) Quantification of the activated Bax by densitometry. Data are represented as mean +/− SD, n=3, **, P<0.01. (E) Colony formation assay on Bax WT or mutant transfected HCT116 Bax/Bak DKO cells. (F) The colonies were quantified by densitometric reading. Data are represented as mean +/− SD, n=3, **, P<0.01, ***, P<0.001.

