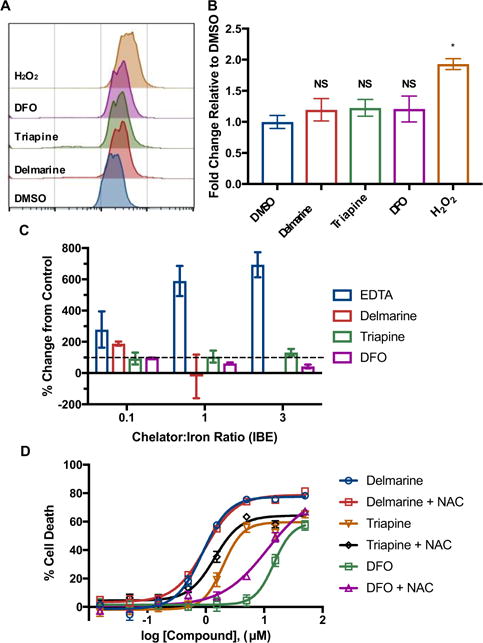
Figure 6.

A) ROS induction as assessed by the ROS-responsive dye H2-DCFDA by flow cytometry. B) Quantification of data in A), N = 3, * = p < 0.001. C) Significant ROS production is not seen in vitro by the ascorbate oxidation assay, N = 3. D) The antioxidant N-acetyl cysteine (NAC) does not protect from cell death induced by iron chelators as assessed in HeLa cells at 48 h by alamar blue, N = 3.
