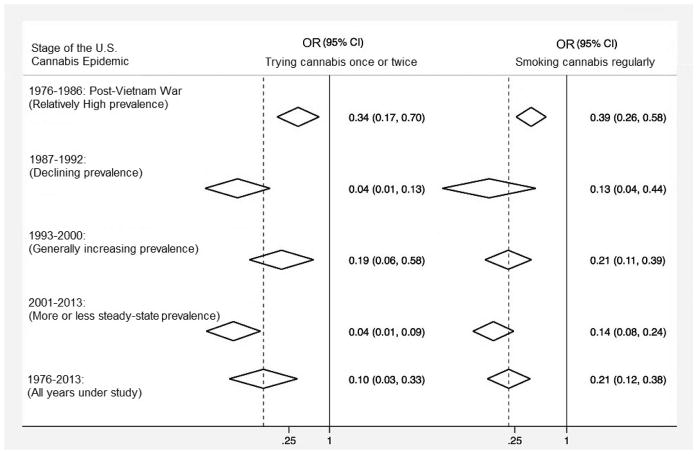
Figure 2.
Estimated stage-specific meta-analysis summary odds ratios (OR) and 95% confidence intervals (CI) for the predictive association from a school-level ‘great risk’ perception about trying cannabis once or twice to the school-level odds of becoming a newly incident cannabis user (left column) and for the corresponding prediction based on ‘great risk’ of smoking cannabis regularly (right column), based on unadjusted Alternative Logistic Regressions.* Data from “Monitoring the Future: Secondary School Students,” United States, 1976–2013.
Note: Estimates from covariate-adjusted models are described in the text. Post-estimation exploratory data analysis estimates based on alternative specifications with equally spaced intervals are shown in Supplementary Figures 1 and 2. Year-specific estimates are available upon request.

