
Fig. 5.
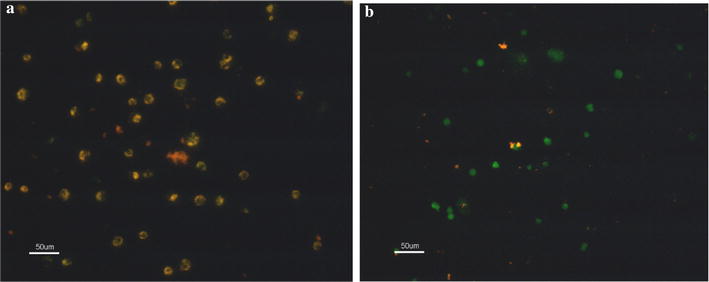
Mitochondrial membrane potential of (a) untreated and (b) treated K562 cells. Almost all cells in the control group showed more red fluorescence, while the lipopeptide-treated cells displayed green fluorescence. The scale bar is 50 μm
Official websites use .gov
A
.gov website belongs to an official
government organization in the United States.
Secure .gov websites use HTTPS
A lock (
) or https:// means you've safely
connected to the .gov website. Share sensitive
information only on official, secure websites.
Mitochondrial membrane potential of (a) untreated and (b) treated K562 cells. Almost all cells in the control group showed more red fluorescence, while the lipopeptide-treated cells displayed green fluorescence. The scale bar is 50 μm