
Fig. 6.
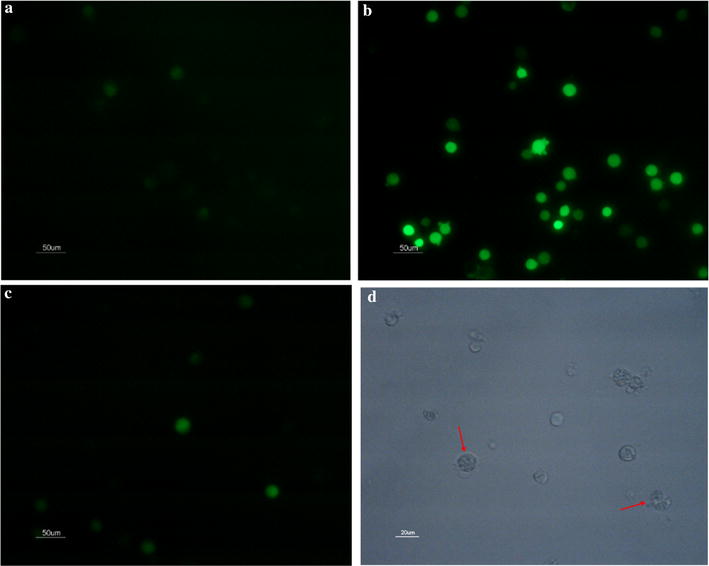
Reactive oxygen species of K562 cells. a The control cells without lipopeptide treatment; b the cells treated with 65.76 μM lipopeptides for 48 h; c the treated cells with ROS inhibitor; the scale bar is 50 μm. a The morphology of cells treated with lipopeptides and ROS inhibitors; the scale bar is 20 μm