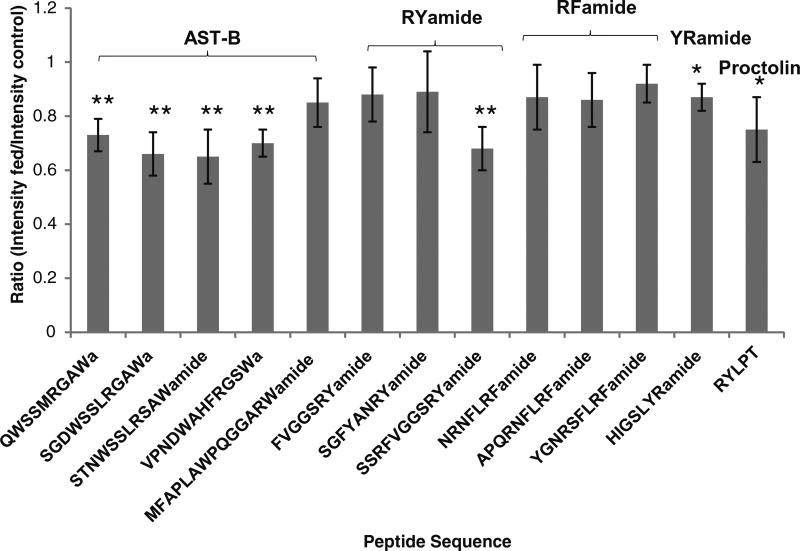
Figure 4.
Abundance ratios of 13 neuropeptides in the POs from fed C. sapidus versus unfed crabs from five groups of feeding experiments. The sequence of each neuropeptide is labeled on the x-axis, and they are organized in the order of families. The y-axis represents the abundance ratio of each neuropeptide between fed and unfed crab. * Indicates p < 0.05, ** indicates p < 0.005 (n = 5)

