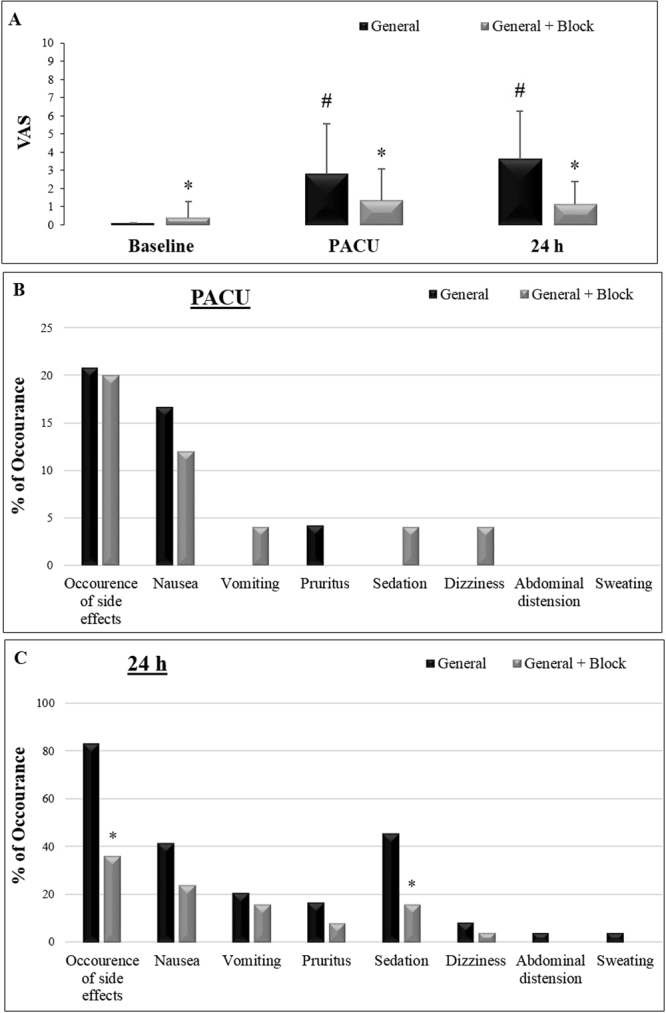
Figure 2.

Pain and side effects measured in both groups: general anesthesia (N = 24) and general anesthesia with SAM block + PECS I (N = 25). (A) Pain levels measured using the Visual Analog Scale (VAS) at baseline, in the post-anesthetic care unit (PACU) and 24 h after surgery. (B) Percentages of side effects during the recovery period in the PACU. (C) Percentages of side effects 24 h after the anesthetic procedure. The data are presented as the mean ± standard deviation. *p < 0.05 compared to the general anesthesia only group. #p < 0.05 compared to baseline.
