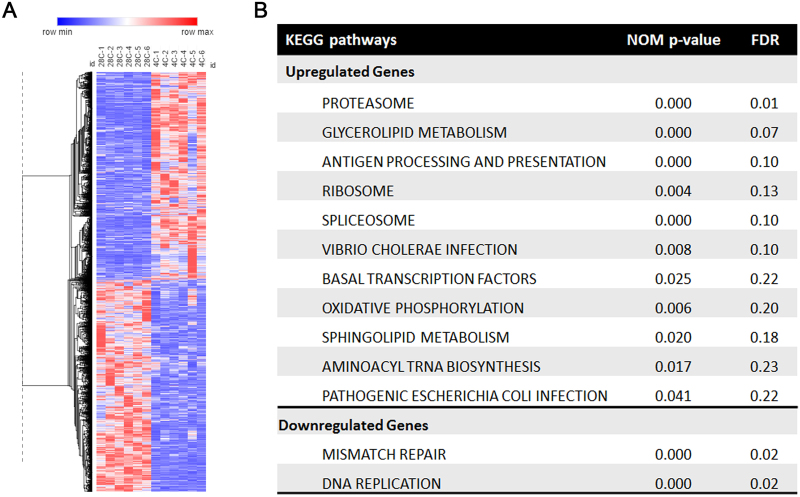
Figure 4.
Differential regulation of brown adipose tissue transcriptome by cold. (A) A heat map of brown adipose tissue transcriptome that is differentially regulated by cold. Upregulated genes are shown in red and downregulated genes are shown in blue, with gradient colors representing the level of expression (deeper shades for higher degree of differential expression). (B) Gene set enrichment analysis (GSEA) showing the pathways enriched in upregulated and downregulated genes in response to cold.

