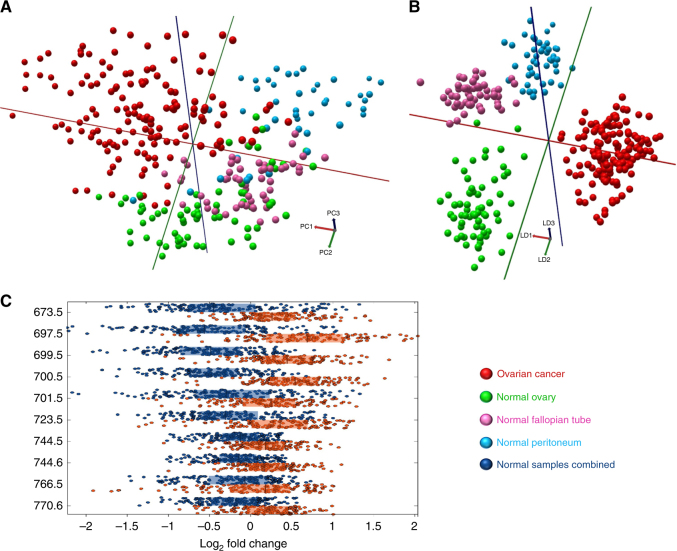
Fig. 2.
Multivariate analyses of ovarian cancer and normal tissue types. a 3-component 3D PCA, percentage of variance explained in PCs1–3: 36.0, 17.6, 9.0%. b 25-component 3D PC-LDA. c Box plots of univariate analysis showing the top m/z peaks contributing to class separation (log2 fold change), between ovarian cancer and normal samples combined. Ten most significant and intense REIMS spectra peaks shown with P < 0.001, q < 0.001. Figure based on the following sample numbers: ovarian cancer n = 39, normal ovary n = 15, normal fallopian tube n = 15, normal peritoneum n = 14

