Fig. 5.
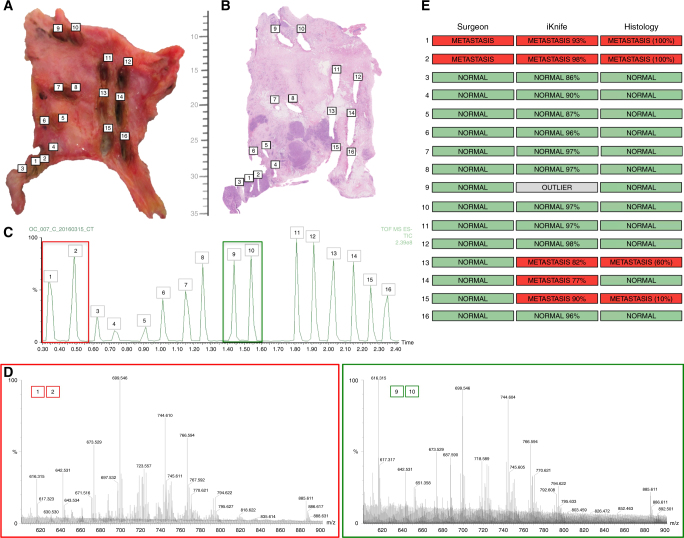
Spatial resolution of metastatic peritoneal deposits and iKnife recognition. a Peritoneum containing metastatic tumour deposits with iKnife burns labelled 1–16 sampling normal peritoneum and tumour nodules. b Matched haematoxylin and eosin histological slide for the tissue sample in panel A with corresponding burn sites numbered. Scale showing millimetres. c Total ion chromatogram obtained during the sampling of the specimen with the iKnife with each burn numbered. Coloured boxes represent data obtained from a nodule (red; burns 1&2) and normal peritoneum (green; burns 9&10). d Representative mass spectra, obtained in negative-ion mode from a nodule (red) and normal peritoneum (green) showing the degree of variability in the MS peaks for different tissue types (OC vs normal). e Surgeon’s histological impression, iKnife’s impression (percentages in parenthesis represent probability of correct classification) and the histopathologist’s final diagnosis (percentages in parenthesis represent tumour cell content)

