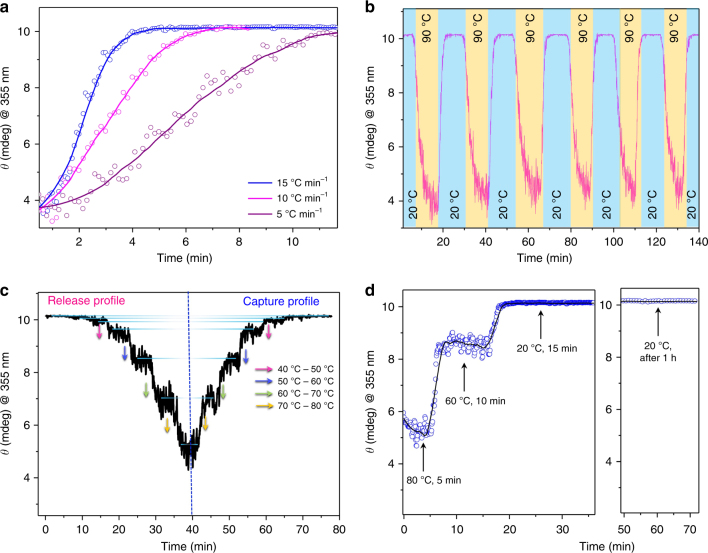
Fig. 6.
Stepwise and reversibly controlled release and capture of α-CD by Mg-CP in solution state. a Temperature-dependent binding of α-CD by Mg-CP with cooling rate of the solution from 15 to 5 °C min−1. Non-linear fit to the observed data points are also represented. b Thermally reversible binding (blue) and release (yellow) of α-CD by Mg-CP. c Stepwise release and capture of α-CD by Mg-CP. The arrows represent the specific changes in the temperature. d A two-step capture profile of α-CD from Mg-CP. The ICD signal remains stable at a particular temperature for the desired amount of time. The plot on the right shows no release of α-CD from Mg-CP at 20°C even after 1 h. Concentration of Mg-CP is 0.06 mg mL−1 and that of α-CD is 1 × 10⁻³ M for all experiments

