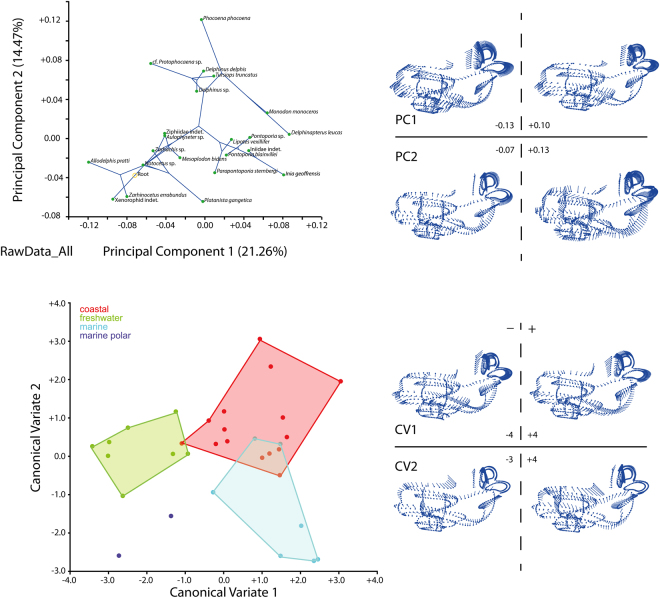
Figure 2.
Top left, Principal Component Analysis of the Raw Data dataset (see text) with superimposed phylogeny. Top right, shape variation of the bony labyrinth on the PCA morphospace. Bottom left, Canonical Variate Analysis of the Raw Data dataset, colors are environmental categories as indicated on the legend. Bottom right, shape variation of the bony labyrinth on the CVA morphospace. Electronic supplementary material 6 completes the results with the sliding protocols and for the subsets analysed (semi-circular canals and cochlea) and Supplementary data 6 gives the results of the geometric morphometric analyses.

