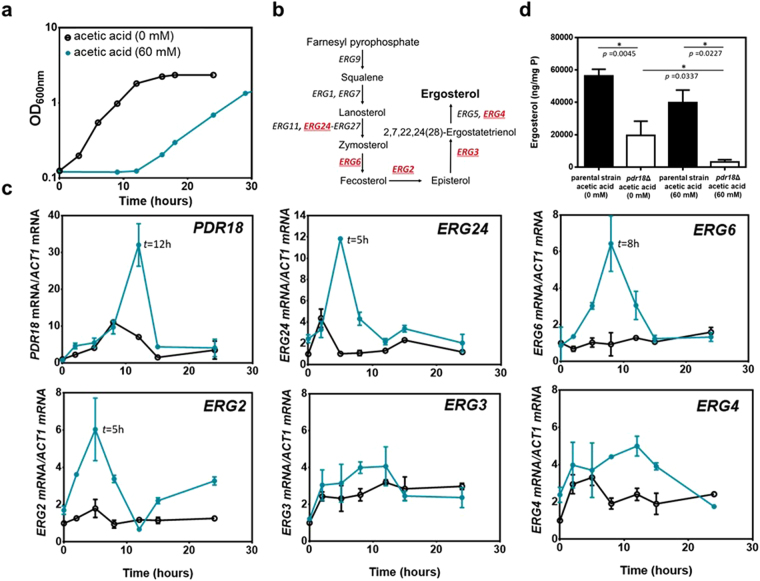
Figure 4.
Levels of mRNA from PDR18 and from several ergosterol biosynthetic pathway genes during cultivation in absence or presence of acetic acid and comparison of ergosterol levels. (a) Growth curve of S. cerevisiae BY4741 in absence (○) or presence ( ) of 60 mM acetic acid (at pH 4.0) based on culture OD600nm. (b) Ergosterol biosynthetic pathway [adapted from KEGG (http://www.genome.jp/kegg/pathway.html)]; the ERG-genes under study are highlighted in red; (c) mRNA levels from the indicated genes by qRT-PCR, using ACT1 as the reference gene. (d) Ergosterol content in cell membranes from exponentially-growing cells of the parental and pdr18Δ strains in the absence or presence of 60 mM acetic acid (60 mM). Error bars represent standard deviation resultant from at least two biological replicates with three technical replicates each.

