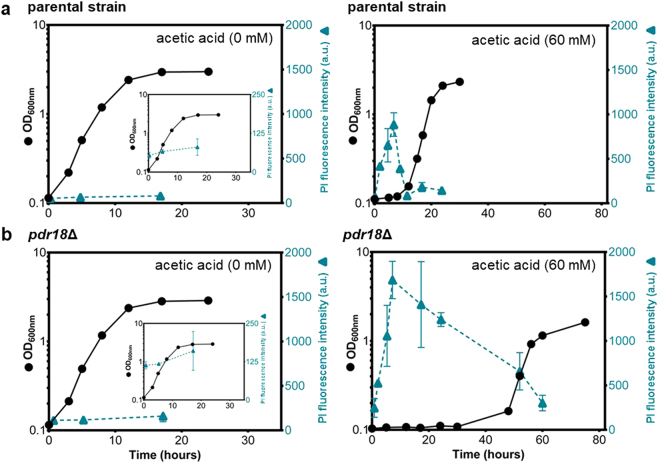
Figure 6.
Plasma membrane permeability of the parental strain and pdr18Δ cells during the growth curve in the presence or absence of acetic acid. Comparison of plasma membrane permeability ( ; arbitrary units) during cultivation of the parental (a) or pdr18Δ (a) strains in the presence or absence of 60 mM acetic acid at pH 4.0. The estimation of plasma membrane permeability is based on the fluorescence intensity values exhibited by yeast cells upon passive accumulation of propidium iodide. Graphs with a more appropriate fluorescence intensity scale are shown to allow comparison between (a) and (b) in the absence of acetic acid. Error bars represent standard deviation (n = 3).

