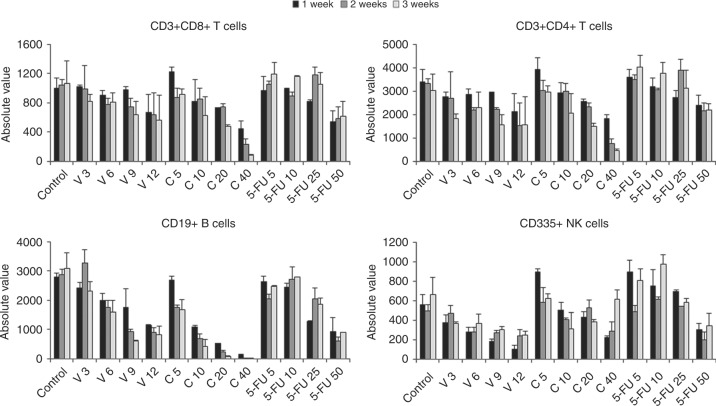
Fig. 2.
Total numbers of T, B and NK cells in mice treated with different types and dosages of chemotherapy drugs. BALB/c mice (n = 5 per study arm) were treated with different dosages of V, C and 5-FU and bleed weekly for 3 weeks to enumerate total numbers of circulating CD3+CD8+ T cells (top panel on the left), CD3+CD4+ T cells (top panel on the right), B cells (bottom panel on the left) and NK cells (bottom panel on the right)

