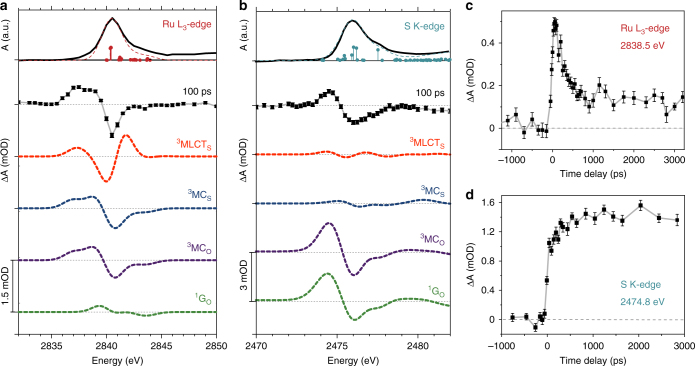
Fig. 3.
Results of TR-XAS measurements and comparison with TD-DFT simulated spectra. Measured and simulated data at the Ru L3-edge (a) and S K-edge (b). Top panel (solid black trace) is the measured absorption spectrum of [Ru(bpy)2(pyESO)](PF6)2 in the S-bonded ground state. The TD-DFT predicted transitions are indicated as sticks and the predicted spectrum is shown by the dashed line (overlaid with the measured spectrum). Below (second from top, square points) is the measured transient differential absorption spectrum at 100 ps time delay. Error bars indicate the standard error of the mean (obscured in some cases by the large size of the data points). All dashed traces below are TD-DFT simulated differential spectra of several proposed excited state intermediates (S-bonded triplet MLCT and MC states: 3MLCTS and 3MCS; O-bonded MC state: 3MCO) and the O-bonded ground state (1GO). The transient measured and simulated difference spectra are all plotted on the same vertical scale, with the amplitude indicated by the scale bars. c Fixed energy time-delay scan measured at the Ru L3-edge (2838.5 eV), including error bars indicating the standard error of the mean. d Fixed energy time-delay scan measured at the S K-edge (2474.0 eV), with error bars indicating the standard error of the mean

