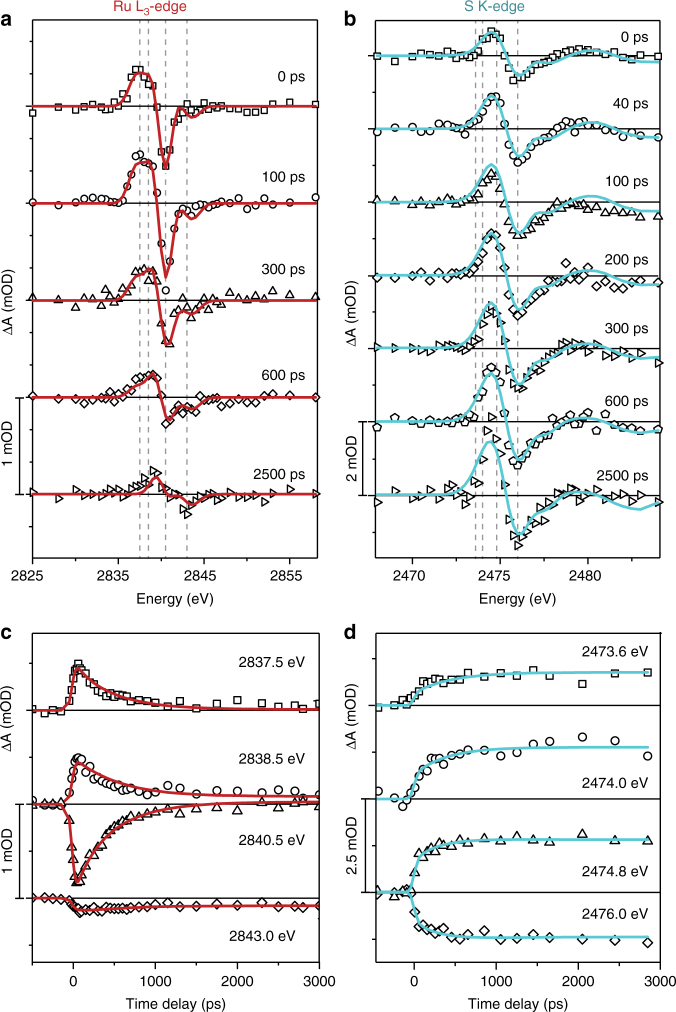
Fig. 4.
Complete TR-XAS data measured for [Ru(bpy)2(pyESO)]2+ and global fit results. Measured TR-XAS data (scattered) is overlaid with the least-square fit to the kinetic model described in the text (solid lines). a, b Differential absorption spectra at several fixed time-delays at the Ru L3-edge (a) and S K-edge (b). Vertical lines indicate the energies monitored as a function of time-delay. c, d Time-delay scans at several Ru L3-edge (c) and S K-edge (d) fixed energies

