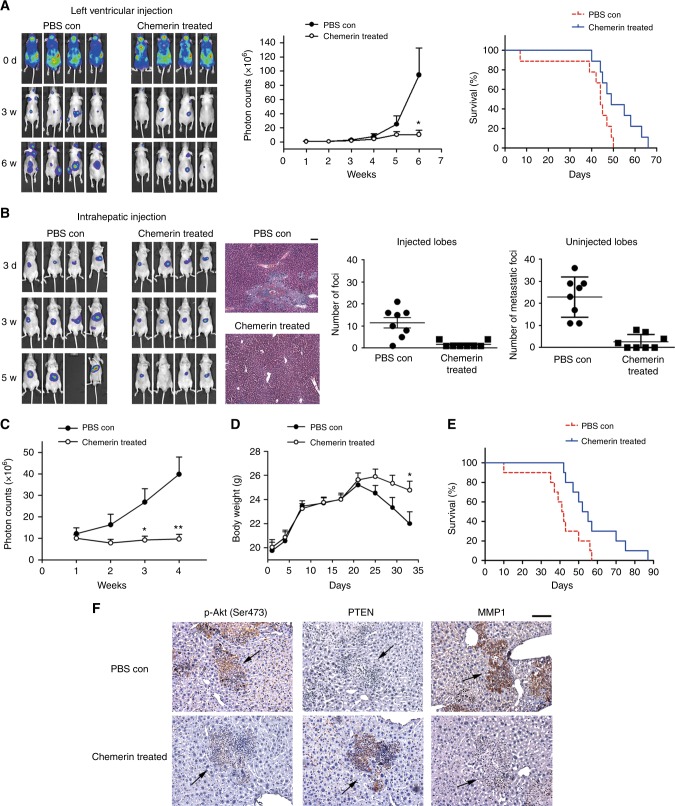
Fig. 6.
Chemerin treatment effectively inhibits HCC metastasis and improves the survival of HCC-bearing mice. a Effect of chemerin is examined in left ventricular injection model. Left, representative images. Middle, mean value of photon counts, data are expressed as mean (±s.e.m.) and are representative of at least two independent experiments. n = 9 mice per group, *p = 0.0379 at the 6th week, Mann–Whitney test. Right, survival curves of the mice. b Effect of chemerin is examined in mice receiving intrahepatic injection. Left, representative images. Middle, H&E stained liver tissue sections. Right, superficial foci on injected lobes (left) and uninjected lobes (right) of PBS con or chemerin treated group were counted. The data are expressed as mean (±s.e.m.) and representative of at least two independent experiments. n = 8 mice per group, p = 0.0012 for the injected lobes, and p < 0.001 for the uninjected lobes, Unpaired t test. c Luciferase signals [mean photon counts (±s.e.m.)] in the intrahepatic injection model. The data are representative of at least two independent experiments, n = 10 mice per group, *p = 0.0213 at the 3rd week, and **p = 0.0047 at the 4th week, Unpaired t test with Welch correction. d Weight [mean (±s.e.m.)] of mice, n = 10 mice per group, *p = 0.0348 for chemerin treated group vs. PBS con group at 33rd day, Unpaired t test. e Survival curves of the mice undergoing chemerin treatment in intrahepatic injection model. f Representative immunohistochemical staining for p-Akt (Ser473) and PTEN of the same foci (indicated by arrows), and MMP1 of different foci on sequential liver tissue sections of the mice in PBS con and chemerin treated group in intrahepatic injection model. Scale bar = 100 µm

