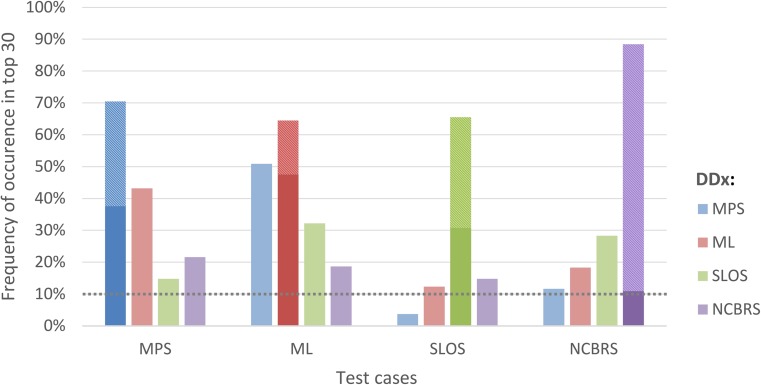
Fig. 2.
Frequency of occurrence of the five disorders as differential diagnoses (DDx) under the first 30 ranks in Face2Gene CLINIC in the respective test groups. The proportion of the correct diagnosis at the first rank is hatched. For instance, the correct diagnosis “MPS” appears in the MPS I and II cohort in 34% of the cases at the top position and in altogether 70% in the top 30. With about 300 DDx to choose from in gestalt match a frequency of occurrence above 10% in the top 30 ranks (dotted line) indicates phenotypic similarity

