
Fig. 1.
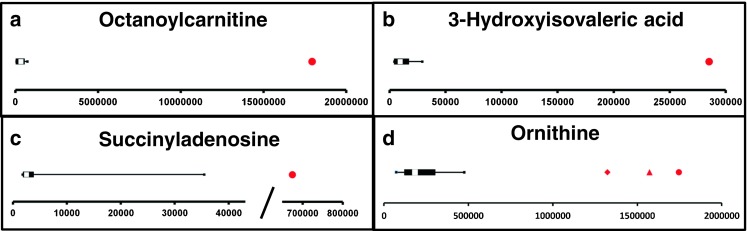
Feature intensity for a selection of inborn errors of metabolism (IEMs.) In all panels, boxplots show feature intensity distribution in control plasma samples, the X-axis represents feature peak area in arbitrary units. The black box represents the middle 50% of the distribution in control plasma samples; white square represents median of this distribution; left and right whiskers represent lowest and highest value measured in controls. Patient values are shown in red. a Medium-chain acyl-CoA dehydrogenase deficiency: data shown for octanoylcarnitine, m/z 288.2179 ([M + H] + adduct, retention time (RT) 9.60 min), which is significantly increased in the patient sample compared with 27 controls (fold change 52.8). b 3-Hydroxy-3-methylglutaryl CoA-lyase deficiency: data shown for 3-hydroxyisovaleric acid, m/z 117.0557 ([M − H] − adduct, RT 3.43 min), which is significantly increased in the patient sample compared with 28 controls (fold change 28.1). c Adenylosuccinate lyase deficiency: data shown for succinyladenosine, m/z 384;1144 ([M + H]+ adduct, RT 4.71 min), which is significantly increased in the patient sample compared with 29 controls (fold change 264.6). d Ornithine amino transferase deficiency: data shown for ornithine, m/z 133.09714 ([M + H]+ adduct, RT 0.49 min), which is significantly increased in three patient samples compared with 27 controls (mean fold change 7.1)