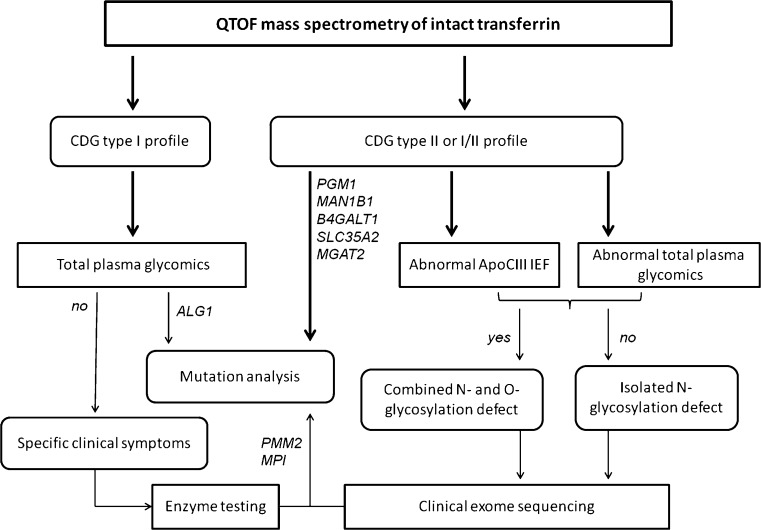
Fig. 3.
Clinical diagnostic flowchart for CDG. The combination of mass spectrometry with clinical exome sequencing and clinical phenotyping allows facile identification of the majority of known CDG-I and CDG-II subtypes in a diagnostic setting. The gene defects mentioned here are examples of characteristic diagnostic glycomics profiles in our laboratory. Please refer to Jaeken and Peanne (2017) and Peanne et al (2017) for clinical symptoms in CDG

