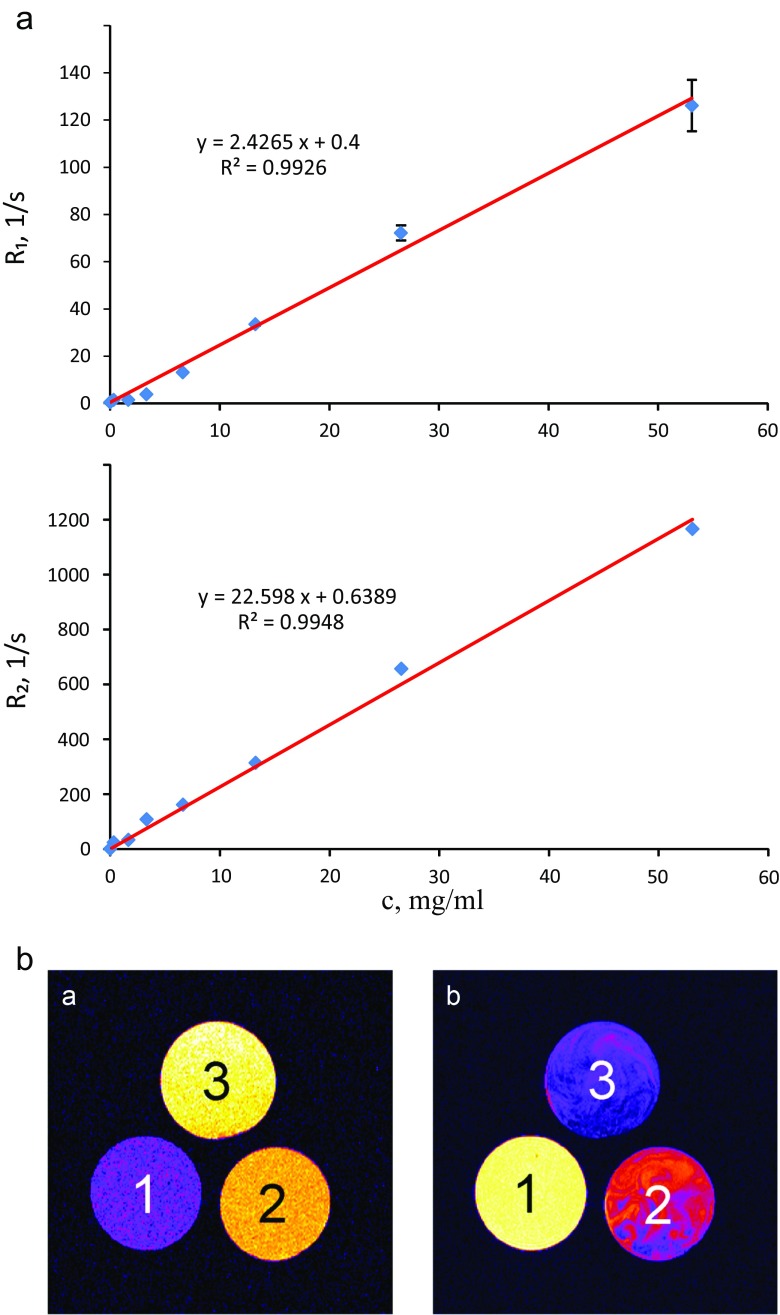
Fig. 5.
Nuclear Magnetic Resonance Relaxometry and Magnetic Resonance Imaging: (a) The quantitative linear correlation between relaxation rates (R1, R2) and concentration of Fe-MIL-101-NH2 in a suspension. (b) MR images of FeMIL-101-NH2 showing the examples of positive (left image) and negative (right image) contrast due to differences in imaging sequence parameters (TR = 0.7 s, TE = 3.5 ms and TR = 3 s, TE = 21 ms respectively)

